Key points about averages from a grouped table

For Continuous data can take any value within a range. It is data which has been measured rather than counted, eg time, length, mass., which contains lots of unique values, it is usually more efficient to group the data. This allows for fewer classes and categories of data to be used.
Used to identify a range of values, eg -1 ≤ × ≤ 2 means values from -1 to 2. are often used to describe the groups in the table. For example, the interval 0 < 𝑡 ≤ 5 means that 𝑡 is larger than 0 but less than or equal to 5.
If data is organised into groups, the exact value of each item of data is not known, just which group it belongs to.
- This means the exact value for the A type of average calculated by finding the value that occurs most often. The mode can have one value, more than one value, or no value., A type of average calculated by finding the middle value of a set of numbers. If there are two middle numbers, the median is the mean of those two numbers. If there are 𝑛 values, the median is the (𝑛+1)/2 th value. or The most commonly used measure of average. To calculate the mean, add the values together and divide the total by the number of values. cannot be found. However, the modal group and the group that contains the median can still be identified.
An To guess roughly or give an approximate value. for the mean can be found by assuming all data values within a group take the The middle of two values or coordinates. of the group.
To support you in finding averages from a grouped frequency table, make sure you are confident in working with averages from an ungrouped table.
Check your understanding
How to find the mode and median from a grouped frequency table
The method for finding the mode and median for a grouped frequency table is no different from the method for an ungrouped table.
To find the mode in a grouped frequency table, identify the row with highest frequency.
The modal class is the group or interval the highest frequency relates to.
To find the median in a frequency table, use the A fact, rule, or principle that is expressed in terms of mathematical symbols. Plural: formulae \( \frac{n+1}{2} \) to find the position of the median, where 𝑛 is the number of pieces of data.
Add up the frequencies in the frequency table to identify which group or interval contains the median.
Find out more below
GCSE exam-style questions
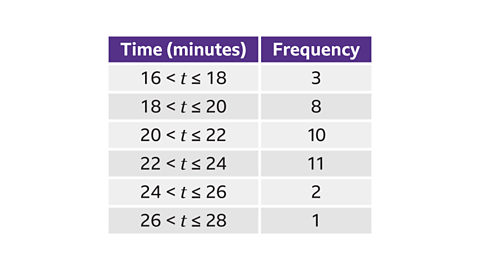
- The table shows the time Simon takes to get home from school over a term.
Find the modal class.
22 < 𝑡 ≤ 24
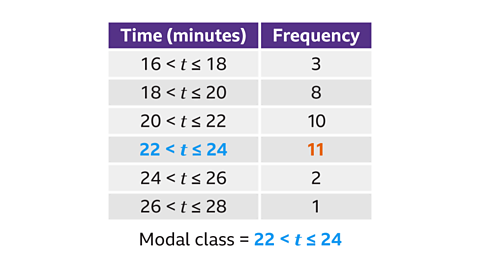
To find the modal class in a frequency table, identify the row with the highest frequency.
The highest frequency is 11, when Simon took more than 22 minutes, but less than or equal to 24 minutes to get home. The modal class is 22 < 𝑡 ≤ 24.
- The table shows the time Simon takes to get home from school over a term.
Which group contains the median time?

20 < 𝑡 ≤ 22
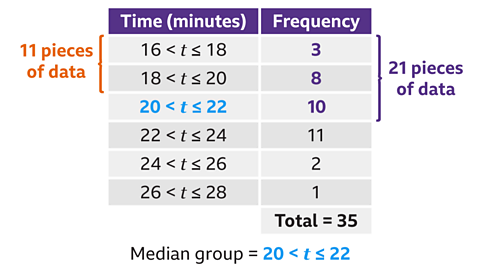
To find the group that contains the median in a grouped frequency table, use the formula \( \frac {n+1}{2}\) to find the position of the median.
Here the total frequency is 35, so there are 35 pieces of data. Adding 1 and dividing by 2 gives 18, so the median is the 18th piece of data.
The first two rows, representing the times Simon took more than 16 minutes, but less than or equal to 20 minutes to get home, add up to 11. The first two rows contain 11 pieces of data.
The third row has a frequency of 10. Collectively, the first three rows have a total of 21. The first three rows contain 21 pieces of data.
This means the 18th piece of data must be contained in the third row. The median is in the interval 20 < 𝑡 ≤ 22.
How to estimate the mean for a grouped frequency distribution
Since no individual values are known for each piece of data in a grouped frequency table, the exact mean cannot be calculated. Instead, an estimate of the mean can be found using midpoints.
To find the estimated mean, when data is presented in a grouped frequency table, use the following method:
Add two additional columns to the frequency table called Midpoints (𝑚) and 𝑓 × 𝑚.
Complete the midpoint column by finding the midpoint of each group interval. This can be found by adding the lower and upper bounds of the group and dividing the total by two.
Multiply each frequency, 𝑓, by its midpoint, 𝑚. Write these values in the new column, 𝑓 × 𝑚.
Add up the total of the 𝑓 × 𝑚 column.
Add up the total of the frequency column, 𝑓.
Divide the total from Step 4 by the total from Step 5.
In some exam questions, the additional columns may already have been created.
Find out more below
GCSE exam-style questions
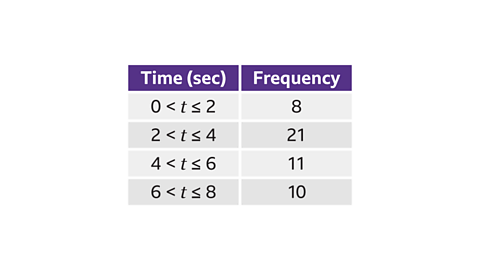
- Alice is playing a game where she listens to a piece of music and guesses the artist.
The table shows the time it takes in seconds for each of her 50 correct guesses.
Estimate the mean time for her correct guesses.
3·92 cm
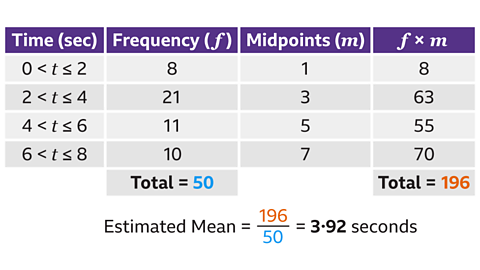
To find the estimate of the mean, add two additional columns, Midpoints and 𝑓 × 𝑚, to the frequency table.
Calculate the midpoints for each interval. These can be found by adding the lower and upper bounds of the group and dividing the total by two. The midpoints are 1, 3, 5 and 7.
Multiply each frequency, 𝑓, by its midpoint, 𝑚.
Write these values in the new column, 𝑓 × 𝑚.
8 × 1 = 8, 21 × 3 = 63, 11 × 5 = 55 and 10 × 7 = 70.
- Add up the values in the 𝑓 × 𝑚 column.
8 + 63 + 55 + 70 = 196
The total frequency is given in the question and is equal to 50.
- Calculate the mean by dividing these totals in the correct order.
196 ÷ 50 = 3·92
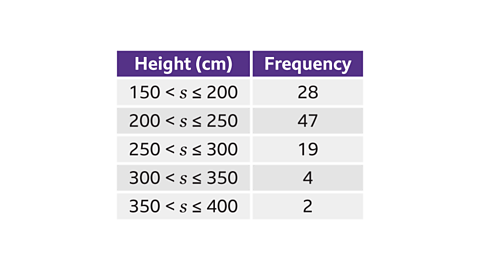
- Ben is measuring the height (cm) of 100 sunflowers.
The grouped frequency table shows the results.
Estimate the mean height.
227·5 cm
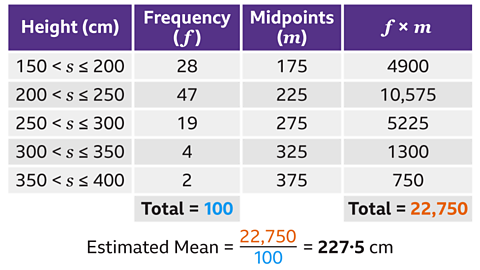
To find the estimate of the mean, add two additional columns, Midpoints and 𝑓 × 𝑚, to the frequency table.
Calculate the midpoints for each interval. These can be found by adding the lower and upper bounds of the group and dividing the total by two.
For example, for the interval 150 < 𝑠 ≤ 200, adding 150 and 200 gives 350. Half of 350 is 175. The other midpoints are 225, 275, 325 and 375.
- Multiply each frequency, 𝑓, by its midpoint, 𝑚.
Write these values in the new column, 𝑓 × 𝑚.
28 × 175 = 4900, 47 × 225 = 10,575, 19 × 275 = 5225, 4 × 325 = 1300 and 2 × 375 = 750.
- Add up the values in the 𝑓 × 𝑚 column.
4900 + 10,575 + 5225 + 1300 + 750 = 22,750
The total frequency is given in the question and is equal to 100.
- Calculate the mean by dividing these totals in the correct order.
22,750 ÷ 100 = 227·5
Quiz - Averages from a grouped table
Practise what you've learned about averages from a grouped table with this quiz.
Now you've revised averages from a grouped table, why not look at Higher – Venn diagrams?
More on Statistics
Find out more by working through a topic
- count1 of 7

- count2 of 7

- count4 of 7