Key points about solving problems using Venn diagrams

A diagram used to sort data. are used to organise data into two or three overlapping sets, presenting a visual guide for problem solving.
Questions may be complex, so it is important to check that the information is correct in the completed Venn diagram.
Understanding the meaning of individual and combined An identified area on a diagram or graph. in a Venn diagram is essential, to solve questions that involve numerical and conditional probability.
Support your confidence in this topic by looking at this Foundation guide on Venn diagrams.
How to solve problems using a Venn diagram, to organise given data
Organising data into a Venn diagram is one strategy for solving complex problems.
This can involve up to three overlapping sets, and the information is usually in the form of the number of A piece of information or a letter, or a number, in a set. Also described as a member of the set. in various regions.
How to draw a Venn diagram to represent a problem
- Draw two or three overlapping circles for the problem.
- Label each circle.
- Consider the meaning of the different overlapping regions.
- Write the numbers that belong in a specific region.
- Where a number is given for more that one region, use subtraction to work out the separate values.
- Check that the sum of all the values is equal to the total number given.
- Solve the problem using the completed Venn diagram.
Follow the worked examples below
i) Use a Venn diagram to organise data and solve a problem
ii) Use a Venn diagram to organise data involving three sets
GCSE exam-style questions

- An online app offers learning of one or more languages from French, Spanish and Italian.
20 people learn French, 20 learn Spanish and 20 learn Italian.
12 people learn all three languages.
4 learn French and Spanish but not Italian.
1 learns French and Italian but not Spanish.
2 learn Italian and Spanish but not French.
Work out how many people only learn one language.
10 people only learn one language.
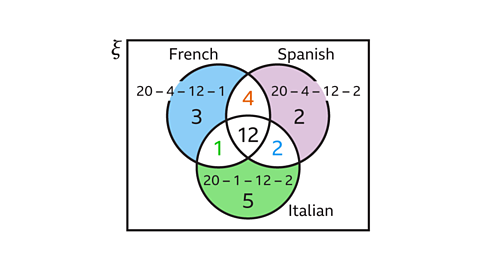
Draw three circles, one for each language, French, Spanish and Italian.
Fill in the numbers that fill single regions:
- 12 learn all three languages
- 4 learn French and Spanish but not Italian
- 1 learns French and Italian but not Spanish
- 2 learn Italian and Spanish but not French
The remaining regions are for those people learning a single language.
- The people who only learn French is
20 – 4 – 12 – 1 = 3. - The people who only learn Spanish is
20 – 4 – 12 – 2 = 2. - The people who only learn Italian is
20 – 1 – 12 – 2 = 5.
- The people who only learn French is
The number of people learning only one language is
3 + 2 + 5 = 10.
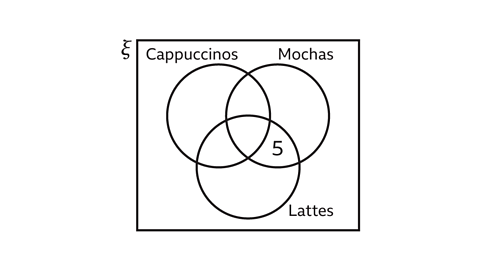
- A group of people are surveyed about which types of coffee they like.
A Venn diagram has been started.
18 people like cappuccinos, 19 people like mochas and 20 people like lattes.
10 people like cappuccinos and mochas.
14 people like mochas and lattes.
11 people like lattes and cappuccinos.
5 people like mochas and lattes but not cappuccinos.
Use the additional information to complete the Venn diagram and work out how many people were in the survey.
31 people were in the survey.
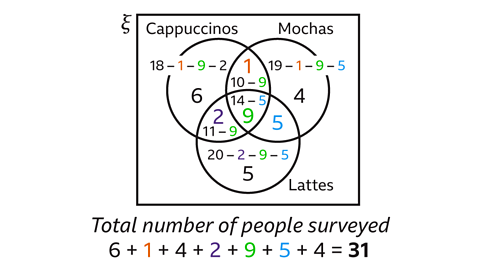
14 people like mochas and lattes.
The number of people who like all three drinks is
14 – 5 = 9.
The number of people who like cappuccinos and mochas is 10.
The number of people who like cappuccinos and mochas but not lattes is 10 – 9 = 1.
The number of people who like cappuccinos and lattes is 11.
The number of people who like cappuccinos and lattes but not mochas is 11 – 9 = 2.
The number of people who only like cappuccinos is
18 – 2 – 9 – 1 = 6.
The number of people who only like mochas is
19 – 1 – 9 – 5 = 4.
The number of people who only like lattes is
20 – 2 – 9 – 5 = 4.
The total number of people in the survey is
6 + 1 + 4 + 2 + 9 + 5 + 4 = 31.
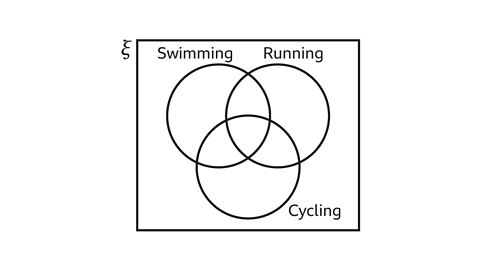
- A group of 60 athletes are training for a triathlon, completing events in swimming, cycling and running.
20 athletes like all three disciplines.
17 prefer swimming and running but not cycling.
22 like running and cycling.
25 like swimming and cycling.
45 prefer only running.
3 prefer only cycling.
Use a Venn diagram to work out the number of athletes who like swimming.
49 athletes like swimming.
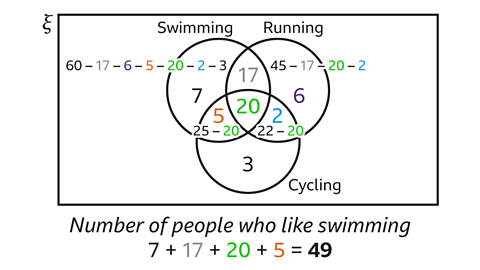
Fill in the numbers for the single regions.
- 20 athletes like all three disciplines.
- 17 like swimming and running but not cycling.
- 3 only like cycling.
Use subtraction to find the missing regions.
- The number of people who like running and cycling but not swimming is 22 – 20 = 2.
- The number who like swimming and cycling but not running is 25 – 20 = 5.
- The number who only like running is
45 – 17 – 20 – 2 = 6. - The number who only like swimming is
60 – 17 – 6 – 5 – 20 – 2 – 3 = 7.
The number of athletes who like swimming is
7 + 17 + 20 + 5 = 49.
Using a Venn diagram to work out conditional probabilities
Conditional probability is the probability of an A possible outcome, for example 'heads' when a coin is tossed. given that another event has occurred.
Usually the denominator for a probability is the total number of A piece of information or a letter, or a number, in a set. Also described as a member of the set. in the Venn diagram.
The numerator of the fraction for a conditional event is the number of elements relating to a given event.
Work out a conditional probability from a Venn diagram
- Identify the region(s) relating to the given event.
- Count the elements or add the frequencies for the given event. This is the denominator.
- Within the identified region(s), count the elements or add the frequencies that satisfy both conditions. This is the numerator of the fraction.
- Write the fraction and simplify if possible.
Follow the worked example below
GCSE exam-style questions
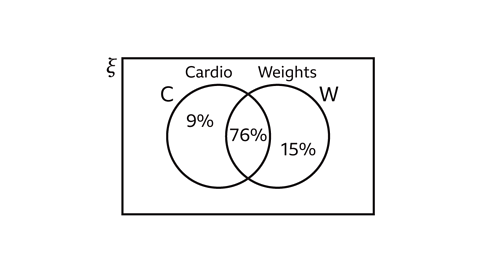
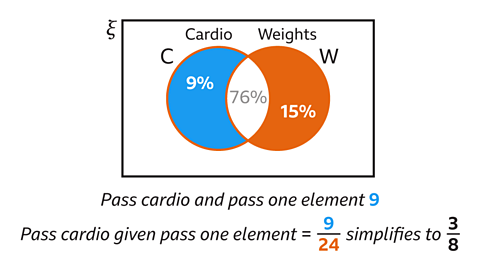
- A fitness test includes two elements: cardio, C, and weights, W.
One day, everyone who took the fitness test passed at least one element.
The percentages are shown in the Venn diagram.
Work out the probability that a person selected at random passed the cardio element, given that they only passed one element.
\(\frac{3}{8} \)
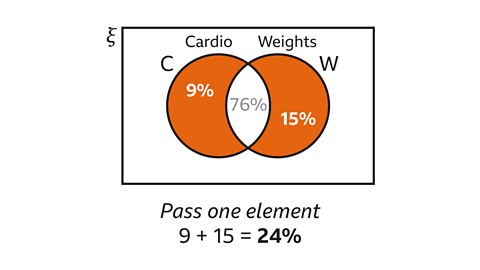
First identify the region(s) relating to the given event, the proportion of people who passed one element is
9% + 15% = 24%.
This is the denominator of the fraction.
The numerator of the fraction is the proportion of people who passed cardio and only passed one element, this is 9%.
𝑃(passed cardio, given only passed one element) = \(\frac{9}{24} \).
This simplifies to \(\frac{3}{8} \).
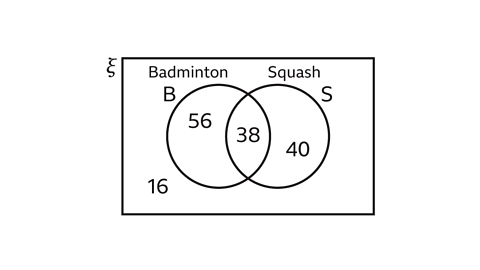
- The Venn diagram shows how many members of a club play badminton or squash.
What is the probability that a member of the club does not play squash, given that they do not play badminton?
\(\frac{2}{7} \)
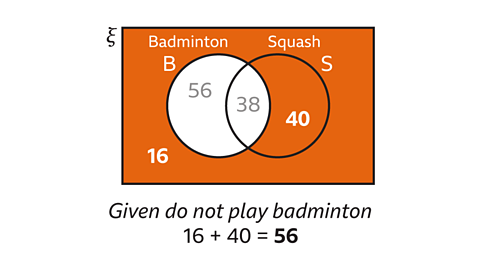
First identify the region(s) relating to the given event, the people who do not play badminton.
This is 𝑛(B') = 16 + 40 = 56.
This is the denominator of the fraction.
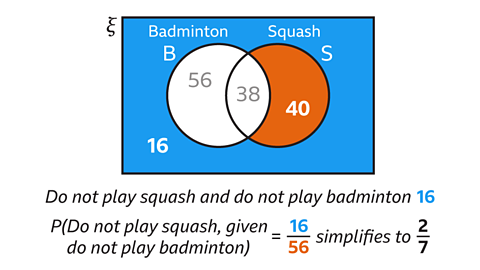
The numerator of the fraction is the number of people who do not play squash and do not play badminton, this is 𝑛(S' and B') = 16.
𝑃(do not play squash, given they do not play badminton) = \(\frac{16}{56} \).
This simplifies to \(\frac{2}{7} \).
- The Venn diagram shows the results of a survey of 100 band members about the instruments they play.
They all play at least one instrument.
Find the probability that a band member plays the guitar, given that they only play one instrument.
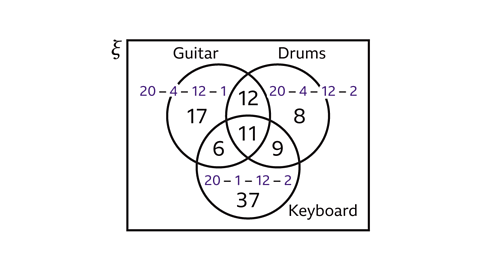
\(\frac{17}{62} \)
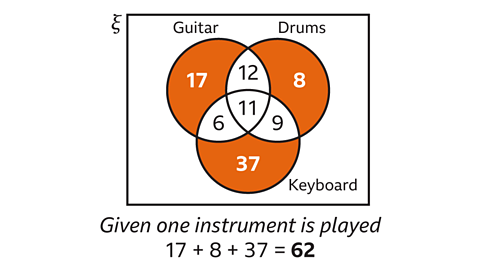
First identify the region(s) relating to the given event, the band members who only play one instrument.
These are the members who play only guitar, plus only drums, plus only keyboard.
17 + 8 + 37 = 62
This is the denominator of the fraction.
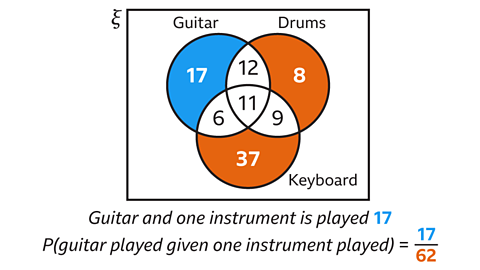
The numerator of the fraction is the number of people who play one instrument and that instrument is a guitar, 17.
𝑃(play guitar, given they play one instrument) = \(\frac{17}{62} \).
Quiz – Solving problems using Venn diagrams
Practise what you've learned about solving problems using Venn diagrams with this quiz.
Now you've revised solving problems with Venn diagrams, why not look at showing outcomes?
More on Probability
Find out more by working through a topic
- count1 of 6
- count2 of 6
- count3 of 6
- count4 of 6