Key points about scatter graphs and time series

A scatter graph or diagram is used to explore the relationship between two sets of data. The data set is called A data set depending on two variables. because it involves two sets of data that can change or vary.
If there is a relationship between the two variables, it is called a A relationship between two variables. . When a scatter graph shows correlation, it may be possible to draw a line of best fit. A line of best fit generalises the trend and is used to make predictions.
A A graph measuring a quantity against time. The periods of time are on the horizontal axis. is used to show changes over a continuous time period. For example, it may show seasonal fluctuations over a period of years.
How to plot a scatter graph
- To produce a scatter diagram, data is required. The data often comes in the form of a table.
Creating a scatter diagram
If axes are not provided, identify the smallest and largest frequencies for both variables in your table.
Draw a horizontal axis on your square paper or graph paper to represent one of the variables.
Choose an appropriate scale for this axis and label your axis. Decide if you need to use a A symbol indicating a break in the scale on an axis. .
Draw a vertical axis on your square paper or graph paper to represent the other variable.
Choose an appropriate scale for this axis and label your axis. Decide if you need to use a false origin.
Plot each data point carefully on the graph.
Check you have labelled each axis correctly and give your scatter diagram a title.
Follow the worked example below
GCSE exam-style questions
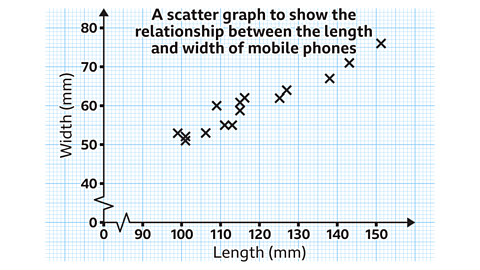
- The scatter graph shows the lengths and widths of mobile phones.
One of the phones has a length of 127 mm.
What is its width?
64 mm
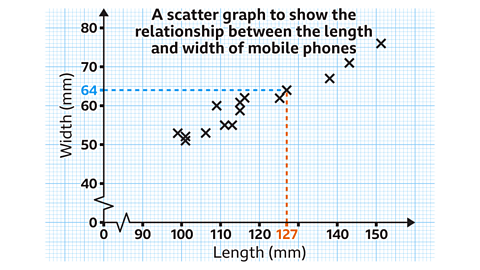
The horizontal and vertical scales are going up in increments of 10. Between each multiple of 10 are ten subdivisions. Each subdivision is worth 1 mm.
The mobile phone with a length of 127 mm has a width measuring 64 mm.
- The scatter graph shows the lengths and widths of mobile phones.
What type of correlation does it show?
Positive correlation
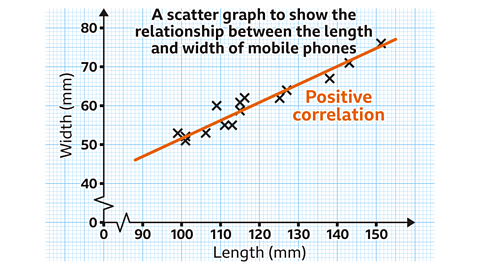
The data points in the scatter graph show that as the length of a mobile phone increases, the width of the mobile phone also increases.
This is a positive correlation.
Check your understanding
How to draw and use a line of best fit
When a scatter diagram has a positive or negative correlation, it is possible to draw a A line which approximates the trend on a scatter graph..
The line of best fit should approximate the trend. It does not have to go through the origin.
It is possible to use the line of best fit to make predictions.
If the prediction is inside the range of given data points it is called Making a prediction within the range of a given dataset. .
If the prediction is outside the range of given data points it is called Making a prediction beyond the range of a given dataset. . Extrapolation is less reliable as it assumes the trend will continue.
If there is a data point that does not fit the trend it is called an A piece of data that does not fit the trend. This could be caused by a mistake in the measuring, recording or plotting of the data. .
Find out more below, along with a worked example
GCSE exam-style questions
- Jacob sells drinks.
The table shows the highest temperature recorded and his sales for 5 days.
He draws a scatter graph and line of best fit.
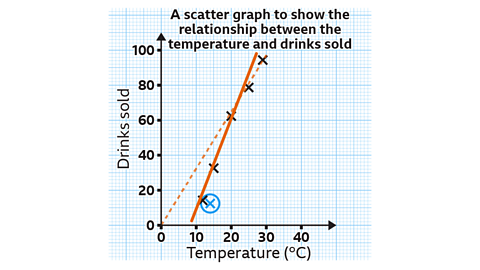
What two mistakes has he made?
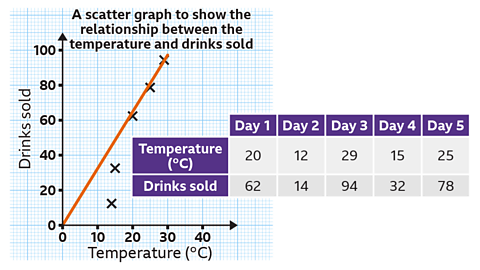
The datapoint (12, 14) has been plotted incorrectly.
The line of best fit does not need to pass through the origin and should approximate the trend.
A better line of best fit is shown in the diagram.
- The scatter graph shows information about 8 apartments in a city.
The graph shows the distance from the city centre and the monthly rent of each apartment.
What type of correlation does this show?
Use the line of best fit to estimate the monthly rent on an apartment 3 miles from the city centre.
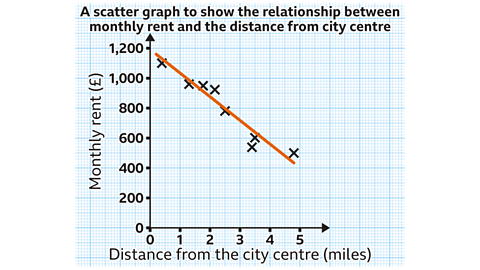
The scatter graph shows a negative correlation.
Estimated monthly rent = £720
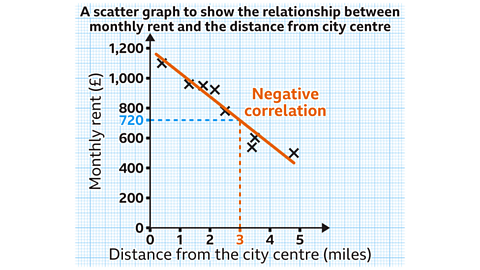
The vertical scale is going up in increments of 200. Between each multiple of 200 is ten subdivisions. Each subdivision is worth £20.
Using the line of best fit, an apartment 3 miles from the city centre would have an expected monthly rent of £720.
How to plot and interpret a time-series graph
The method for plotting a A graph measuring a quantity against time. The periods of time are on the horizontal axis. is similar to that of a scatter graph.
The period of time is always plotted in equal steps along the horizontal axis.
Once all the data points are plotted, the points are connected by straight lines to emphasise patterns and changes over time.
The number of data points will depend on the period of time being recorded. For example, a graph showing an annual period would have 12 data points, one for each month.
Find out more about plotting time-series graphs below
Predicting a value
GCSE exam-style questions
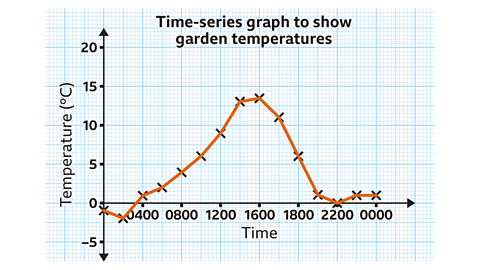
- The graph shows the temperature in a garden over 24 hours.
At what times was the temperature 6 °C?
1000 and 1800 hours
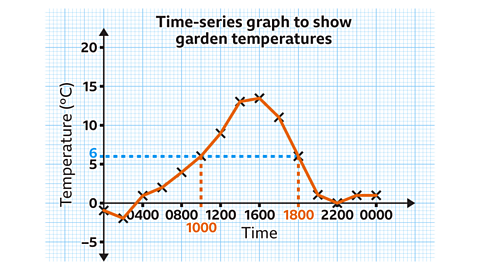
The vertical scale is going up in increments of 5. Between each multiple of 5 are ten subdivisions. Each subdivision is worth 0·5 °C.
The garden has a temperature of 6 °C at two different times, 1000 and 1800 hours.
- An annual music festival has taken place since 2018.
The time series graph shows the number of people who attended each year.
Use the graph to estimate the number of people attending the festival in 2026.
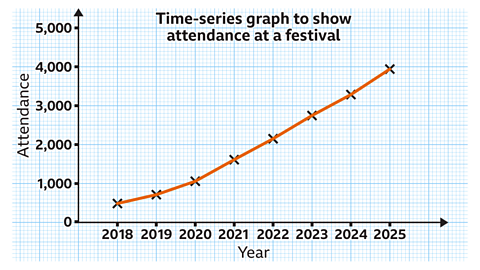
Approximately 4,550
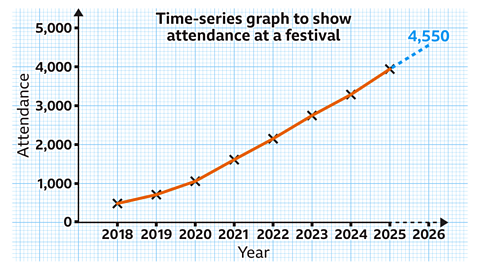
Historically, since 2020 the attendance has increased linearly by approximately 600 attendees each year. Continuing this trend, a good estimate for the attendance in 2026 would be 4,550 people.
Quiz – Scatter graphs and time series
Practise what you've learned about scatter graphs and time series with this quiz.
Now you've revised scatter graphs and time series, why not look at probability?
More on Statistics
Find out more by working through a topic
- count2 of 7

- count4 of 7

- count5 of 7