Key points about averages from an ungrouped table

A A table used to organise data by listing each unique value or group of values and showing how many times it appears., with The cells of a table that go horizontally. and The cells of a table that go vertically., is used to organise and manage a A collection of unprocessed information..
Averages calculated from a table provide a representative value that are used to summarise a dataset.
- The three main types of average are the A type of average calculated by finding the value that occurs most often. The mode can have one value, more than one value, or no value., A type of average calculated by finding the middle value of a set of numbers. If there are two middle numbers, the median is the mean of those two numbers. If there are 𝒏 values, the median is the ⁿ⁺¹⁄₂ th value. and The most commonly used measure of average. To calculate the mean, add the values together and divide the total by the number of values., which each give a different way to identify what is typical within the set of raw data.
When calculating averages from a frequency table, the method for finding each measure is different from that of a list of numbers.
Make sure you are confident at working with averages from a list of raw data.
How to find the mode and median for a discrete frequency distribution
- The mode is the most frequent piece of data in a set.
To find the mode in a frequency table, identify the row with the highest frequency.
The mode is the value the highest frequency relates to.
- The median is the middle number in a set of data. It is not the middle group.
To find the median in a frequency table, use the formula \( \frac{𝑛 + 1}{2} \) to find the position of the median, where 𝑛 is the number of pieces of data.
Add up the frequencies in the frequency table to identify which row contains the median.
Find out more below
Check your understanding
GCSE exam-style questions

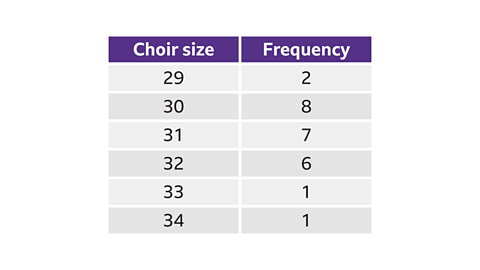
- The table shows the number of singers in 25 choirs in a competition.
What is the modal choir size?
30
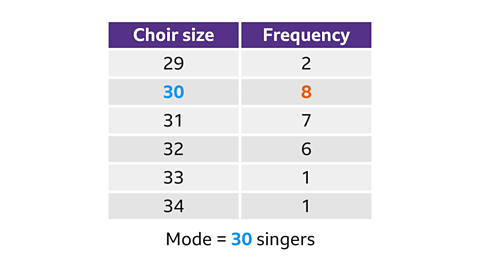
To find the mode in a frequency table, identify the row with the highest frequency.
The highest frequency is 8, when choirs have 30 singers, so the mode is 30.
- The table shows the numbers of singers in 25 choirs in a competition.
What is the median choir size?
31
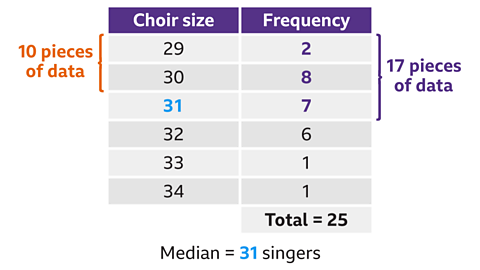
To find the median in a frequency table, use the formula \(\frac{𝑛 + 1}{2} \) to find the position of the median.
Here the total frequency is 25, so there are 25 pieces of data. Adding 1 and dividing by 2 gives 13, so the median is the 13th piece of data.
The first row, representing a choir size of 29, has a frequency of 2.
The second row, representing a choir size of 30, has a frequency of 8. Collectively, these have a total of 10.
The third row, representing a choir size of 31, has a frequency of 7. Collectively, the first three rows have a total of 17.
Therefore, the 13th piece of data falls within the 3rd row and must be 31.
The median choir size is equal to 31.
- The table shows the number of pieces of mail delivered to an address over a period of 30 working days.
What is the median number of pieces of mail delivered?
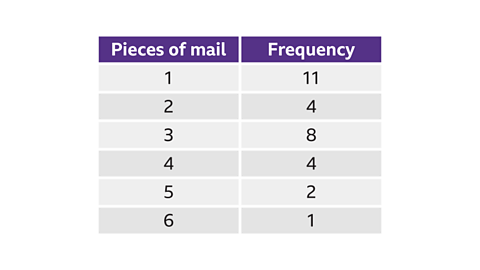
2·5
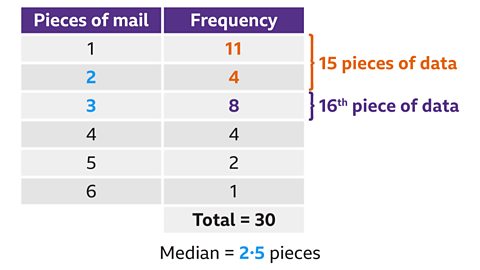
To find the median in a frequency table, use the formula \(\frac{𝑛 + 1}{2} \) to find the position of the median.
Here the total frequency is 30, so there are 30 pieces of data. Adding 1 and dividing by 2 gives 15·5, so the median is the value between the 15th and 16th pieces of data.
The first row, representing 1 piece of mail, has a frequency of 11.
The second row, representing 2 pieces of mail, has a frequency of 4. Collectively, these have a total of 15. The 15th piece of data must be a 2.
The 16th piece of data is in the next row and therefore must be a 3.
The median is the number in the middle of these two values, which equals 2·5 pieces of mail.
How to find the mean for a discrete frequency distribution
The mean is the most commonly used average and is also known as the arithmetic average.
It is found by first finding the total of the values in the dataset and then dividing by how many pieces of data there are.
To find the mean when data is presented in a table, use the method below.
- Add an additional column to the frequency table.
- Multiply each subject value, 𝑥, by its frequency, 𝑓. Write these values in the new column 𝑥 × 𝑓.
- Add up the total of the 𝑥 × 𝑓 column.
- Add up the total of the frequency column.
- Divide the total from Step 3 by the total from Step 4.
Follow the worked example below
Interactive activity – Mean from a frequency table
This interactive activity will help you understand how to find the mean from a frequency table.
GCSE exam-style questions
- The table shows the number of goals scored in 10 hockey matches.
What is the mean number of goals scored?
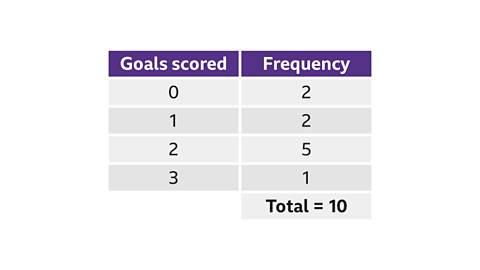
1·5 goals
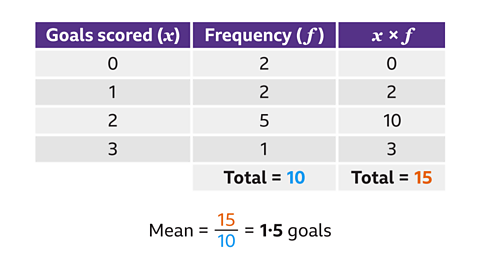
To find the mean, add an additional column, 𝑥 × 𝑓, to the frequency table. In this table the goals scored is the subject value, 𝑥 and the frequency column is labelled 𝑓.
Multiply each subject value, 𝑥, by its frequency, 𝑓. Write these values in the new column, 𝑥 × 𝑓.
0 × 2 = 0
1 × 2 = 2
2 × 5 = 10
3 × 1 = 3
- Add up the values in the 𝑥 × 𝑓 column.
0 + 2 + 10 + 3 = 15
The total frequency is given in the question and is equal to 10.
- Calculate the mean by dividing these totals in the correct order.
15 ÷ 10 = 1·5
- 20 people were asked how many cats they owned.
The table shows the results.
Calculate the mean number of cats owned per person.
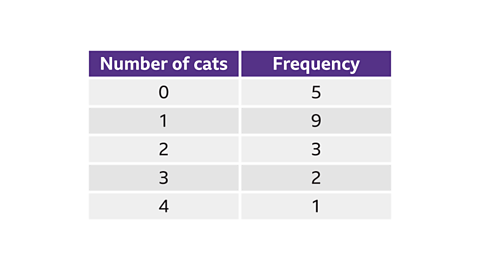
1·25 cats
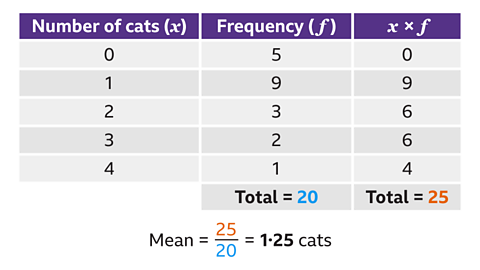
To find the mean, add an additional column, 𝑥 × 𝑓, to the frequency table. In this table the number of cats is the subject value, 𝑥, and the frequency column is labelled 𝑓.
Multiply each subject value, 𝑥, by its frequency, 𝑓. Write these values in the new column, 𝑥 × 𝑓.
0 × 5 = 0
1 × 9 = 9
2 × 3 = 6
3 × 2 = 6
4 × 1 = 4
- Add up the values in the 𝑥 × 𝑓 column.
0 + 9 + 6 + 6 + 4 = 25
The total frequency is given in the question and is equal to 20.
- Calculate the mean by dividing these totals in the correct order.
25 ÷ 20 = 1·25
- The table shows the number of singers in 25 choirs in a competition.
What is the mean choir size?
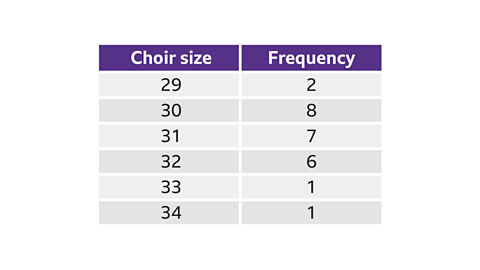
30·96 singers
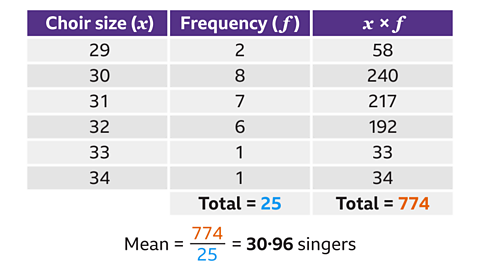
To find the mean, add an additional column, 𝑥 × 𝑓, to the frequency table. In this table the choir size is the subject value, 𝑥 and the frequency column is labelled 𝑓.
Multiply each subject value, 𝑥, by its frequency, 𝑓. Write these values in the new column, 𝑥 × 𝑓.
29 × 5 = 58
30 × 8 = 240
31 × 7 = 217
32 × 6 = 192
33 × 1 = 33
34 × 1 = 34
- Add up the values in the 𝑥 × 𝑓 column.
58 + 240 + 217 + 192 + 33 + 34 = 774
The total frequency is given in the question and is equal to 25.
- Calculate the mean by dividing these totals in the correct order.
774 ÷ 25 = 30·96
You should always write down your exact answer here, eg 30·96, and not round it up or down, eg 31.
Quiz – Averages from an ungrouped table
Practise what you've learned about averages from an ungrouped table with this quiz.
Now you've revised averages from an ungrouped table, why not look at relative frequency?
More on Statistics
Find out more by working through a topic
- count7 of 7

- count1 of 7

- count2 of 7