Key points about relative frequency

Relative frequency is an estimate of The chance of an event happening. The probability of an event has a value from 0 to 1 and is written as a fraction, a decimal or as a percentage. The notation for the probability of an event is 𝑃(event). worked out from collected data. Theoretical probability is based on known facts.
The relative frequency is compared to the theoretical probability to decide whether a coin or a dice is fair or Not fair.. The greater the number of A single performance of an experiment, for example the rolling of a dice. Use the plural, trials, for repeated actions., the more reliable the data for the relative frequency.
The expected number of outcomes is calculated by multiplying the probability of an event by the number of trials.
Look at this guide on experimental probability and relative frequency for further revision support.
Check your understanding
What is relative frequency and reliable data?

The relative frequency of an A possible outcome, for example 'heads' when a coin is tossed. is based on collected data such as rolling a dice, collecting weather data and recording clutch sizes for puffins.
Theoretical probability is based on factual data.
This can be used in the case of a dice being rolled because all possible outcomes are known.
Relative frequency is calculated by dividing the number of times an event happens by the total number of trials.
The greater the number of trials, the more reliable the relative frequency.
The An agreed form of presentation for mathematical information. for relative frequency is the same as for theoretical probability, 𝑃(event).
This can have a value from 0 to 1 and may be written as a fraction, decimal or a percentage.
Follow the worked example below
GCSE exam-style questions

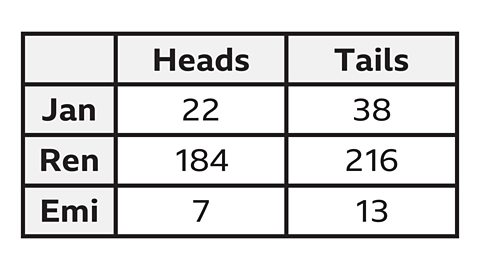
- Jan, Ren and Emi are experimenting to see if a coin is fair or biased.
Their results are shown in the table.
Whose results are the most reliable?
Ren's results are the most reliable.
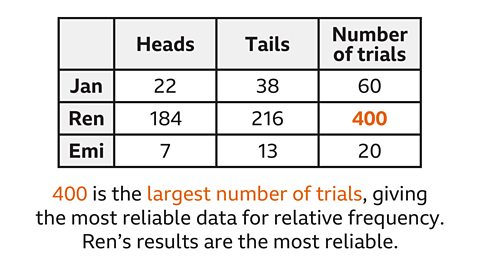
The more trials, the more reliable the data and the relative frequency.
Ren has conducted the most trials, so the relative frequency from their data will be the most reliable.
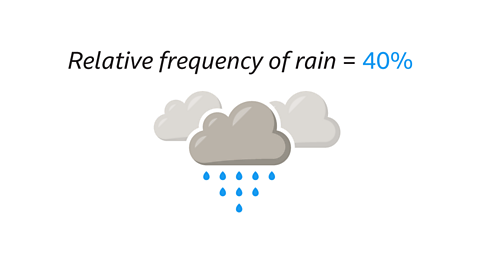
- Fran records the weather over a long period of time and observes that it rains on 40% of the days.
Assuming that this is constant throughout the year, how many days of the next year will see rain?
146 days will see rain in the next year.
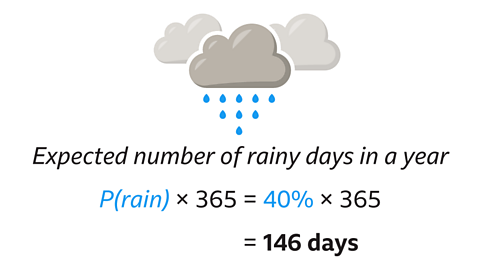
The expected number of outcomes is 𝑃(event) multiplied by the number of trials.
The relative frequency of rainy days is 40%.
A year has 365 days.
40% × 365 gives the expected number of rainy days in a year.
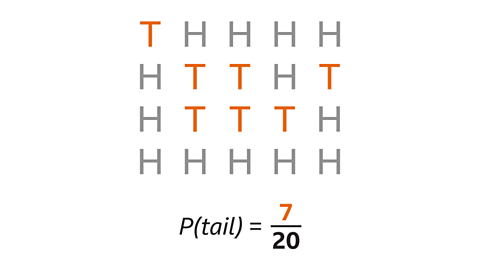
- Rayan flips a coin.
His results are shown below.
Find the relative frequency of flipping a tail.
Give your answer as a fraction.
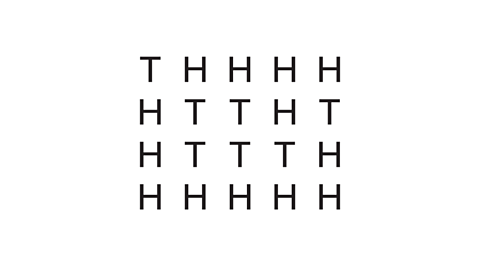
The relative frequency of flipping a tail is \(\frac{7}{20} \).
Seven tails are flipped out of twenty trials.
How to understand and use relative frequency diagrams
A graph can represent relative frequency:
- for a set of outcomes of an event
- of a specific outcome for an increasing number of trials
Use the graph to give the relative frequency of an event.
Use the relative frequency to find the expected number of outcomes.
Follow the worked example below
GCSE exam-style questions
- A bag contains purple, orange and blue counters.
The graph showing the relative frequency of taking a coloured counter from a bag is unfinished.
Complete the diagram with the relative frequency of taking out an orange counter.
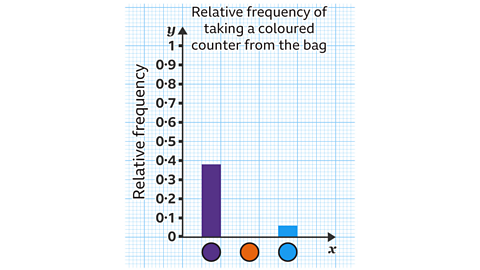
The relative frequency of an orange counter being taken out of the bag is 0·56.
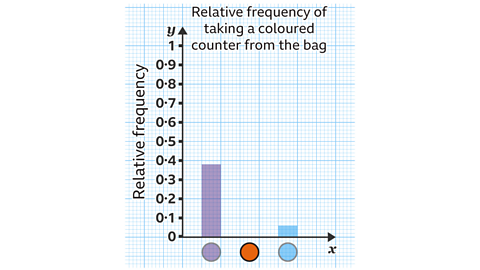
𝑃(purple) = 0·38
𝑃(blue) = 0·06
The relative frequencies add up to 1.
1 – 0·38 – 0·06 = 0·56
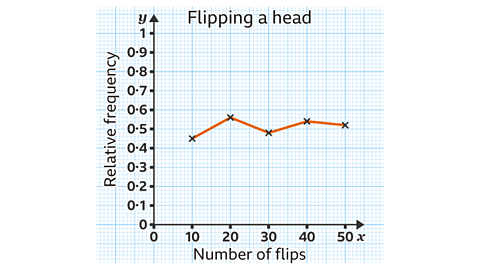
- A coin is flipped 10, 20, 30, 40 and 50 times.
The relative frequency of flipping a head is plotted for the increasing number of trials.
Which is the best estimate for the relative frequency of flipping a head?
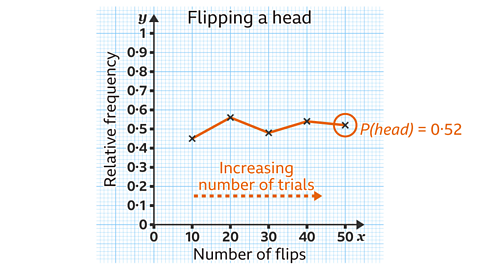
The most accurate relative frequency is based on the greatest number of trials.
For 50 flips (the greatest number of trials) the relative frequency is 𝑃(head) = 0·52.
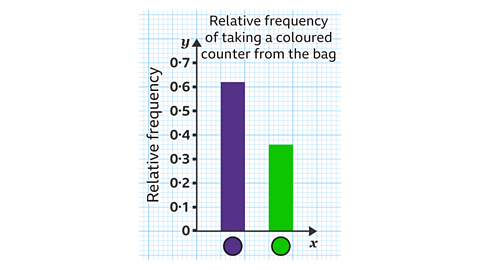
- A bag contains only purple and green counters.
Explain why the graph showing the relative frequency of taking each colour cannot be correct.
The relative frequencies given don't add up to 1.
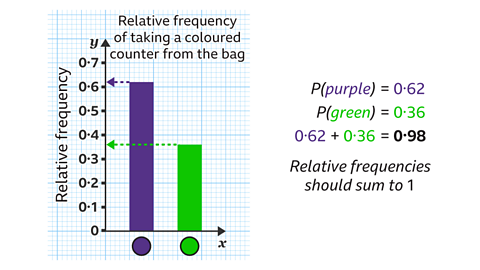
𝑃(purple) = 0·62
𝑃(green) = 0·36
0·62 + 0·36 = 0·98
The sum of the relative frequencies should be 1.
Quiz – Relative frequency
Practise what you've learned about relative frequency with this quiz.
Now you've revised relative frequency, why not look at frequency tables, charts and diagrams?
More on Probability
Find out more by working through a topic
- count3 of 6
- count4 of 6
- count5 of 6