Key points about averages from a list of numbers

An A single ‘typical’ value that is used to represent a set of values. The most commonly used averages are mean, median and mode. provides a representative value that is used to summarise a A set of collected information.. The three main types of average are the A type of average calculated by finding the value that occurs most often. The mode can have one value, more than one value, or no value., A type of average calculated by finding the middle value of a set of numbers. If there are two middle numbers, the median is the mean of those two numbers. If there are 𝑛 values, the median is the (𝑛+1)/2 th value., and The most commonly used measure of average. To calculate the mean, add the values together and divide the total by the number of values.. These each give a different way to identify what is typical within the set of A collection of unprocessed information..
The The difference between the highest and lowest values in a set of numbers. measures spread. It represents the distance between the lowest and highest values and shows how dispersed the data points are.
When analysing data, averages and the range work together to give a complete picture. Choosing the right average depends on the nature of the data.
It is particularly important to consider A value that is significantly different from the rest of the values in a dataset. It is much smaller or larger than most of the other values in the dataset. that might distort results, when deciding which average to use.
Explore averages from an ungrouped table or chart to revise averages that can be calculated from data presented in tables.
How to find the mode from a list of raw data
The mode is the most frequent piece of data.
Depending on the dataset, the mode can be a Data that is not numbers, eg words. value.
To identify the mode for a large numerical set of data, it is useful to order the values first.
Follow the worked examples below
GCSE exam-style questions
- A list of the temperatures in Sheffield for the first fortnight in February is shown.
Find the modal temperature.

2°C
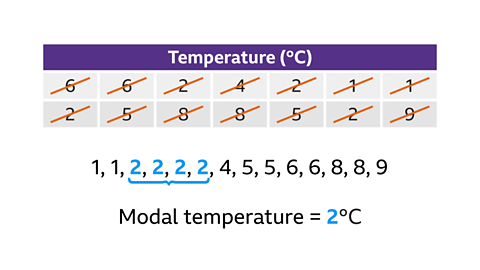
The mode is the value that occurs the most. Rewrite the temperatures in order first and look for which number is listed most frequently.
In this example, there are more 2s than any other number.
- A list of goals scored by a football team in the past 16 games is shown.
What is the modal number of goals scored?
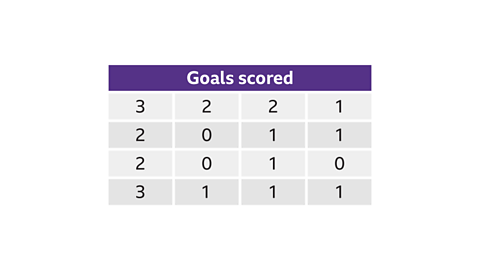
1 goal
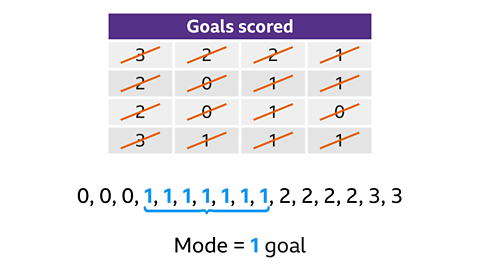
The mode is the value that occurs the most. Rewrite the numbers in order first and look for which number is listed most frequently.
In this example, there are more 1s than any other number.
How to find the median from a list of raw data
The median is the middle number in a set of data that has been arranged in ascending or descending size order first.
If there is an odd number of items of data, there will be one number in the middle. If there is an even number of items of data, there will be two numbers in the middle. The median is the number that is halfway between these two numbers.
To find the median, first put all numbers into ascending or descending order and work towards the middle by crossing off numbers at each end.
When a larger number of items of data is listed, \(n\), the position of the median can be found using the following formula:
Median position = \( \frac{𝑛 + 1}{2} \)
An advantage of using the median is that the middle value is not affected by outliers. Outliers, which take extreme values, will have little or no impact on the middle of the distribution.
Follow the worked examples below
GCSE exam-style questions
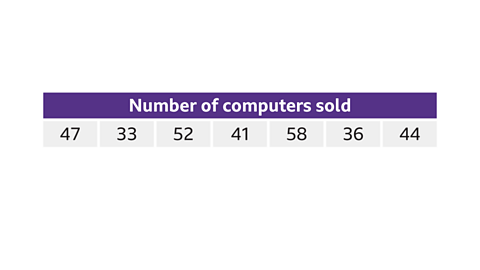
- A list of the number of computers sold each day by a retailer is shown.
Find the median number of sales.
44
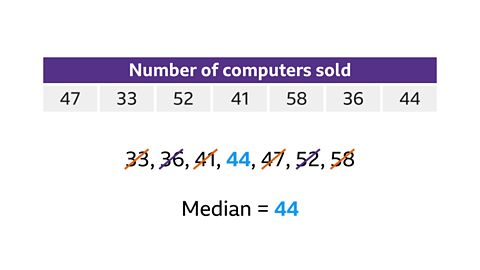
The median is the middle value when the values are put in order.
Rewrite the numbers in order from lowest to highest. Cross off the lowest and highest value repeatedly in pairs.
In this example, there is one value left in the middle, 44. The median number of sales is 44.
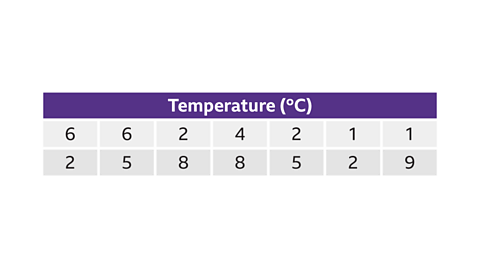
- A list of the temperatures in Sheffield for the first fortnight in February is shown.
Find the median temperature.
4·5°C
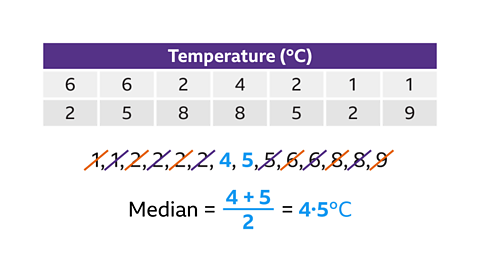
The median is the middle value when the values are put in order.
Rewrite the temperatures in order from lowest to highest. Cross off the lowest and highest value repeatedly in pairs.
In this example, there are two values left in the middle: 4 and 5.
The median is the number in the middle of these two values. To work out the number in the middle of 4 and 5, add them together and divide by 2.
The median is therefore 4·5°C.
How to find the mean from a list of raw data
The mean is the most commonly used average, and can also be called the arithmetic average.
It is found by finding the total of the values in the dataset and dividing by how many pieces of data there are.
The mean takes into account all the values to calculate the average.
As a consequence, very small or very large values, known as outliers, can affect the mean.
Follow the worked examples below
GCSE exam-style questions
- The table shows the mass (kg) of 8 guinea pigs.
Find the mean mass. Give the answer to 3 significant figures.

1·06 kg
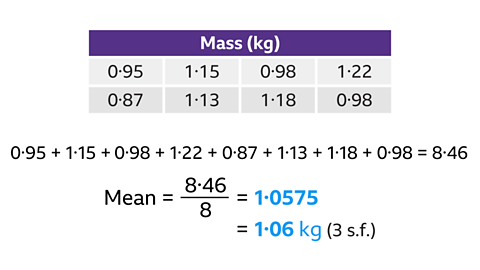
Calculate the mean by adding all the values, then dividing by how many values there are.
The sum of all the masses is 8·46 kg. Dividing this total by 8 gives the answer of 1·0575.
Rounded to 3 significant figures the mean mass is 1·06 kg.
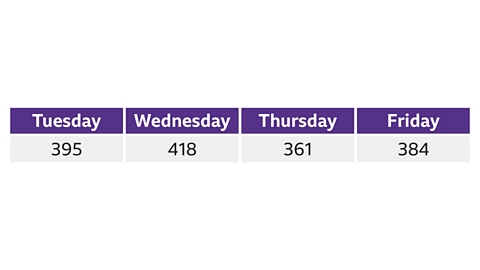
- A musical takes place each day from Monday to Friday.
The table shows the attendance on four of the days.
For all five days, the mean attendance is 380.
Work out the attendance on Monday.
342
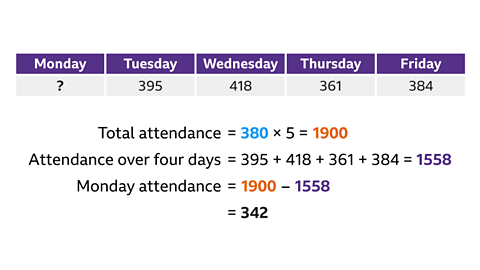
- Calculate the total attendance over the five days by multiplying the mean, 380, by the number of days.
380 × 5 = 1900
1900 people attended the musical during the week.
- Calculate the attendance for Tuesday to Friday by adding the values in the table.
395 + 418 + 361 + 384 = 1558
- Calculate the attendance on Monday by subtracting the attendance over the four days from the total attendance.
1900 – 1558 = 342
The attendance on Monday was 342 people.
How to find the range from a list of raw data
The The difference between the highest and lowest values in a set of numbers. shows how spread out a set of data is. If the range is small, the dataset values are closer together and more consistent.
To calculate the range of a dataset, subtract the smallest value from the largest value.
As the range only takes account of 2 values in the dataset, the smallest and largest, it can be greatly affected by A value that is significantly different from the rest of the values in a dataset. It is much smaller or larger than most of the other values in the dataset..
Follow the worked examples below
GCSE exam-style questions
- The table shows the mass (kg) of 8 guinea pigs.
Calculate the range.
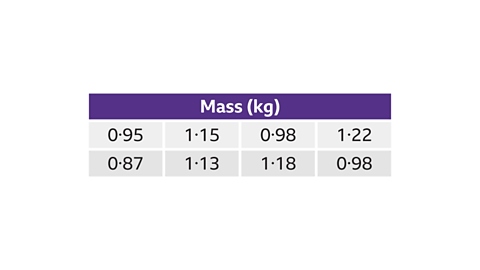
0·31 kg
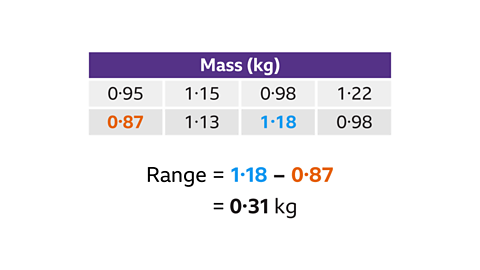
To find the range, subtract the lowest value from the highest value. The lowest value is 0·87 and the highest value is 1·18.
1·18 – 0·87 = 0·31
The range is 0·31 kilograms.
- The masses of some pieces of furniture were recorded.
The largest mass was 148·5 kg.
The range of the masses was 62·8 kg.
What was the smallest mass?
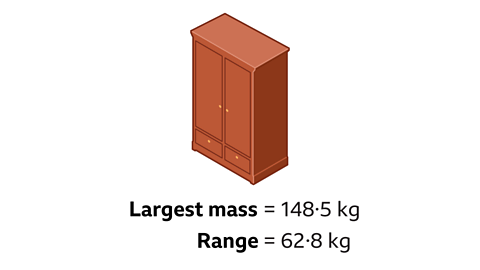
85·7 kg
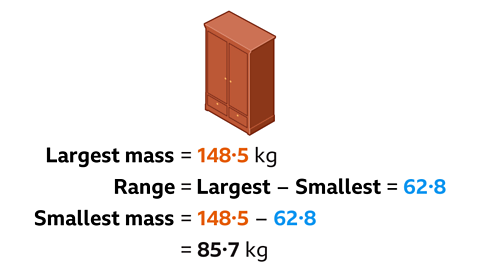
The range, 62·8 kg, is the difference between the largest and smallest masses.
To find the smallest mass, subtract the range from the largest mass.
148·5 – 62·8 = 85·7
The smallest piece of furniture has a mass of 85·7 kg.
Check your understanding
Quiz - Averages from a list of numbers
Practise what you've learned about averages from a list of numbers with this quiz.
Now you've revised averages from a list of numbers, why not look at tree diagrams?
More on Statistics
Find out more by working through a topic
- count6 of 7

- count7 of 7

- count1 of 7

- count2 of 7