Social and economic inequality
Quick version
Social and economic inequality looks at differences in income, wealth, health, and access to resources between different groups of people. Different groups are defined by factors like gender, location, ethnicity, age, and disability.
Inequality is measured through reports and statistics.
Income includes earnings from wages and investments.
Wealth includes total assets such as property and savings, as well as income.
Income and wealth gaps have grown sharply within the UK over the last twenty years.
Video - Inequality in the UK
Watch this video to learn about economic inequality in the UK including how factors like education, job access, and social connections can influence income levels, and what are some of the strategies being used to tackle it.
Inequality in society
Economic inequality is when financial resources are not shared equally amongstmembers of society.
Inequality is a major cause of persistent poverty, as people's income can beaffected by education level, access to jobs or social groups.
In the UK, the poverty line is officially defined at around 60% of the medianyearly income.
There are many government policies and organisations that aim to reducepoverty. The welfare state has many social provisions to reduce poverty.It is paid for out of tax and national insurance.
So those with higher incomes pay more to support those who have less.
Some provision is general, like the NHS providing free health care for everyone.Some is targeted to help specific groups.
For example, state pensions give older people an income.
Cold weather payments help pensioners and people with disabilities or youngchildren with their fuel costs.
People who are out of work can receive practical support to help them findemployment, as well as financial support like Jobseeker's Allowance.
In return, Jobseeker's must demonstrate that they are actively looking for a job.Benefits are also used to top up the income of people on low pay.
This is intended to minimise the number of people stuck in a welfare trap wherefinding a job might result in a lower income because of loss of benefits.
The national minimum wage also aims to help people in low paid jobs.
It is the minimum amount per hour that employers must legally pay theirworkers.
Everyone over the age of 23 is legally entitled to the National Living Wage, whichis a higher amount.
Both are in place to reflect the cost of living.
There are many reasons people are unable to access work that can move themout of poverty, including education levels, care responsibilities and the costs ofchildcare and travel.
Since 2016, the Scottish Parliament has been responsible for a number of welfarebenefits in Scotland, including Disability Payments and Carer's Allowance.
Best Start Grants for young children and the Bereavement Support Payment.In Scotland there has been free bus travel for over 60s since 2006 and for under22s from 2022 and the Scottish Government introduced access to free periodproducts in 2021.
Charities and non-profit organisations also provide services to reduce inequalityin society.
There are charities that provide food and hygiene banks and help with housingand emergency accommodation.
Health charities can support people with advice and resources.
Some help people with disabilities or health conditions meet the costs of mobilityaids and adaptations. or training and assistance to help them find work.
By introducing policies to reduce inequality and support people in need,governments, charities and other organisations hope to create a fairer society foreveryone.
Learn in more depth
Keep going to learn more on:
- What is social and economic inequality?
- How is inequality measured?
- What is defined as income and wealth?
- What are recently income and wealth inequality trends in the UK?
Then test how much you have learned.
What is social and economic inequality?
Social and economic inequality is the extent to which there are differences between groups of people in society.
Social and economic inequality can relate to differences in income and wealth, or to differences in health. Inequality can relate to the following:
- the most deprived and least deprived groups
- gender
- different geographical areas
- different ethnic groups
- disabilities and health issues
- age, ie children, young people, middle aged, pensioners
How is inequality measured?
A huge range of reports and statistics published annually detail links between poverty, life expectancy, unemployment, mortality (death) and morbidity (illness) rates and help to measure levels of inequality.
When referring to reports and statistics, it is important to recognise that each different source of information may have its own way of expressing inequality and compiling statistics.
Exam tip - It is essential to ensure statistics are explained accurately and sources of information are cited for reference.
Income and wealth inequality
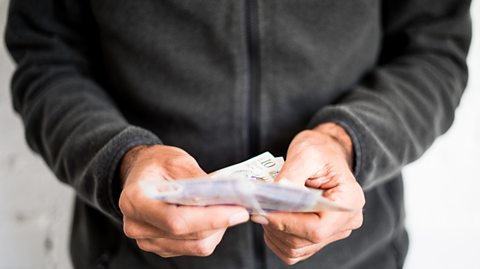 Image source, Basak Gurbuz Derman / Getty Images
What is income?
Income is generally understood to cover a person’s earnings. This could come from the following:
- wages from employment
- dividends from shares and stocks
- pension payments, etc
What is wealth?
Wealth includes income but also the total value of a person’s assets, eg:
- housing or other property
- personal possessions, such as artwork or jewellery
- money in the bank
- the value of stocks and shares, etc
Image source, Basak Gurbuz Derman / Getty ImagesHow have income and wealth inequalities changed?
For several years income and wealth inequalities have been widening in the UK.
A 2023 report by the charity Oxfam, found the following:
- The richest 1% of people in the UK have more wealth than 70% of the rest of the UK population put together.
- The four richest British people alone, have more wealth than 20 million people.
In Scotland there are also wide income and wealth inequalities. Oxfam reported the following:
- The richest 10% of Scots had 217 times more than the most deprived 10% of Scots.
- A typical household in the wealthiest 10% of households had £1.3 million in total wealth.
- A typical household in the least wealthy 10% of households had £7,600.
(Sources: Oxfam, Scottish Government)
Trends in income and wealth inequality
- In the 1980s the income of the wealthiest 10 per cent of people in the UK was eight times that of the poorest 10 per cent. (Source: OECD)
- By 2011, the incomes of the wealthiest 10 per cent had grown to 12 times that of the poorest 10 per cent. (Source: OECD)
- By 2016, the richest 10% of households had 44% of all wealth, whereas the poorest 50% own just 9% (Source: Equality Trust)
- By the end of 2021, the top 20% of people took home 36% of the total income compared to the bottom 20% which took home only 8%. Put another way, the top 20% had a disposable income of £83,867 whereas the bottom 20%, had a disposable income of £13,218. (Source: Equality Trust)
- In 2026, wealth in the UK is distributed even more unevenly than income. 157 billionaires own nearly £670 billion which is over 22 pence of every pound. At the same time, the 50 richest families own more wealth than the poorest 34 million put together. (Source: Equality Trust)
Quiz
Recap what you have learned
Social and economic inequality spans differences in:
- income
- wealth
- health
- access to resources
Inequality can affect various groups defined by gender, location, ethnicity, age, and disability.
Inequality is measured through detailed reports and statistics, which link poverty, life expectancy, and health outcomes to assess disparities across society.
Income refers to earnings from sources like wages and investmentsWealth includes both income and total assets such as property and savings.
Trends in inequality show income and wealth gaps have widened significantly in the UK in recent decades.
More on Inequality
Find out more by working through a topic
- count3 of 9
- count4 of 9