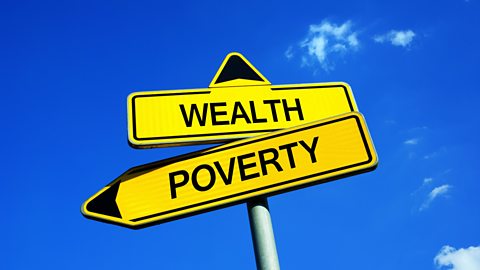
Different kinds of poverty
Quick version
Poverty is a key indicator of inequality.
Absolute poverty, refers to severe deprivation where individuals struggle to meet basic daily needs like food, shelter, sanitation, and healthcare.
Relative poverty, defines poverty as people having basic needs met but lack enough income to fully participate in society, leading to social exclusion.
The UK Government defines the poverty line as 60% of the median household income.
Health inequality takes into account:
- Life expectancy disparities
- Healthy life expectancy
- Mortality rates
- Gender differences
- Ethnic health inequalities
Learn in more depth
Keep going to learn:
- What are the different types of poverty?
- What is health inequality?
- How does gender and ethnic group affect health inequalities?
Then test how much you have learned.
What are the different kinds of poverty?
Differences in income and wealth are reflected in levels of poverty.
What is absolute poverty?
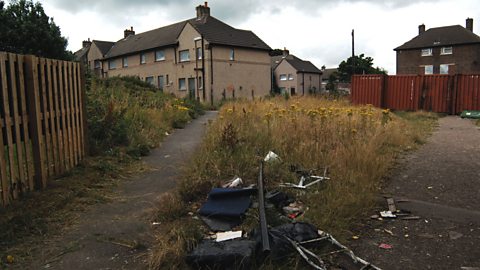
Absolute poverty (sometimes called absolute low income) refers to a level of poverty where people struggle to meet daily needs, such as food, shelter, sanitation and healthcare.
In a 2026 report from the House of Commons Library:
- 16% of people in the UK were in absolute low income before housing costs in 2024/25
- 20% were in absolute low income after housing costs.
What is relative poverty?
In the UK, poverty is more often defined as relative poverty rather than absolute poverty.
Relative poverty (sometimes called relative low income) is used to describe when people who are living in poverty have (in the main) basics such as an adequate diet or somewhere to live.
People in relative poverty lack sufficient income to be able to participate fully in society. People in relative poverty are said to be ‘socially excluded’.
A UK Parliament report published in 2026 found 13.4 million people in the UK, including four million children are living in relative poverty.
BBC News: More than 13 million living in poverty, new figures show
What is official poverty?
There is no one single definition of poverty. Most official definitions use relative income to measure the extent of poverty.
The key UK Government measures take 60 per cent of median income as the poverty line. A family earning less than 60% of the median household income is said to be in relative poverty.
A Minimum Income Standards Report for the UK by Loughborough University in 2025 found to avoid living in poverty:
- a single person has to earn - £30,500 a year
- a couple of working age with no children has to earn together - £43,000 a year
- a lone parent with two children would need to earn - £61,000 per year
- a couple with two children would need to earn - £74,00 per year
What is health inequality?
Not everyone will live to the same age and not everyone will enjoy equally good health throughout their life.
As with income and wealth, there is a huge range of reports and statistics detailing health inequalities in Scotland and the UK.
In recent years, some of the most-well cited reports include the following:
- Equally Well Report (2008 and follow-up of 2010)
- Audit Scotland's Health Inequalities in Scotland (2012)
- Annual Scottish Health Survey
There are also NHS local briefings, Scottish Government updates and other organisations such the Glasgow Central for Population and Health which can provide detailed information on health inequalities.
Health inequalities in Scotland and the UK
 Image source, georgeclerk / Getty Images
Life expectancy in Scotland is the lowest life expectancy among UK countries. Health inequalities are most significant between the richest and poorest in society and the parts of Scotland (and the UK) in which these people tend to live.
For example, the National Records of Scotland reported in 2022-2024 that life expectancy for females in Glasgow City (a local authority area with one of the highest levels of deprivation) was only 78.7 years, compared to females in East Renfrewshire (a local authority area with one of the lowest levels of deprivation) at 84.9 years.
For males, life expectancy in Glasgow City was 74.3 years for males compared to East Renfrewshire at 81.5 years.
Overall, for males in 2022-2024, there were 13.2 years difference for males between the most and least deprived areas of Scotland. For females the difference was 10.5 years. Over the last few years this gap has widened between the least and most deprived areas of Scotland.
(Source: National Records of Scotland)
Image source, georgeclerk / Getty ImagesLife expectancy - Nations of the UK 2022-2024
| Country | females | males |
|---|---|---|
| England | 83.3 | 79.4 |
| N.Ireland | 82.6 | 78.8 |
| Wales | 82.2 | 78.3 |
| Scotland | 81.1 | 77.1 |
How does ethnic group affect health inequalities?
Evidence of race or ethnic health inequalities in Scotland is not widely available but statistically, ethnic minority groups tend to have better health than the majority white population. Having said that, for some health statistics some minority groups fare worse than others and patterns vary from one health condition to the next.
For example, the Scottish Government reported in 2015 that:
- most ethnic minority groups reported better health than the majority ‘White Scottish’ group
- Both 'White Gypsy/Traveller' men and women tended to report nearly twice as many long-term limiting health problems or disability compared to the ‘White: Scottish’ group.
- Both Pakistani men and women reported slightly higher rates of long-term limiting health problems or disability compared to the ‘White: Scottish’ group
- 'Chinese',‘White: Polish’ and 'Other Asian' women in Scotland reported almost half as many long-term limiting health or disability problems compared to ‘White: Scottish’ women. This was also the case for ‘White: Polish’, 'African' and 'Chinese' men
- Some illnesses such as diabetes are more common in people from ethnic minority backgrounds
What are the trends in health inequality?
Has life expectancy changed in Scotland?
 Image source, Epic Scotland Ltd / Alamy
 After several decades of increasing life expectancy at birth, life expectancy fell during COVID 10 and in the last few years has risen to a similar level to before the pandemic.
Figures form 2022 – 2024 show:
- Life expectancy is lower in the most deprived areas by 8.7 years for females and 11.1 years for males.
- Healthy life expectancy gaps are larger: 23.4 years for females and 20.8 years for males.
(Source: National Records of Scotland)
Image source, Epic Scotland Ltd / Alamy Is life expectancy the same for everyone?
However, not all groups across society are experiencing the same fall in life expectancy or healthy life expectancy. In most cases, the most deprived groups have experienced greater falls in life expectancy and healthy life expectancy that the least deprived groups.
In terms of Scotland’s biggest killers – coronary heart disease, cancer, and stroke – there were significant falls in death rates across all socio-economic groups until about 2014, but this trend has begun to slow or for some illnesses reversed.
As with life expectancy, the most deprived groups have higher death rates from these (and most other causes of death) than the least deprived.
For example, the Scottish Government reported in 2023, that for cancer of the trachea, bronchus and the lung, the reported rate was 116.8 per 100,000 people in the most deprived 10 per cent of the population, compared to just 23.6 per 100,000 in the least deprived 10 per cent of the population.
Quiz
Recap what you have learned
Absolute poverty is when individuals cannot afford basic necessities like food, shelter, and healthcare.
Relative poverty, more commonly used in the UK, occurs when people have basics but lack enough income to fully participate in society.
The UK defines poverty as earning less than 60% of the median income.
Health inequality refers to differences in health and life expectancy among various groups.
Significant health inequalities exist between men and women, with women tending to live longer than men.
Ethnic minority groups tend to have better health than the majority white population, although some minority groups fare worse than others depending on the health condition.
The most deprived groups experience greater falls in life expectancy and healthy life expectancy as well as higher death rates that the least deprived groups.
Scotland’s biggest killers are coronary heart disease, cancer, and stroke.
More on Inequality
Find out more by working through a topic
- count3 of 9
- count4 of 9
- count6 of 9