Key points about probability

Probability is the chance of an A possible outcome, for example 'heads' when a coin is tossed. happening. It can take any value from 0 to 1 and is written as a proper fraction, a decimal or a percentage.
The An agreed form of presentation for mathematical information. used for the probability of an event is 𝑃(event).
The sum of the probabilities of all possible outcomes is 1.
Number facts including recognising factors, multiples, prime numbers and square numbers often appear in probability questions.
Make sure you are confident in converting between fractions, decimals and percentages, as probability questions may use a mixture of these.
Check your understanding
The probability scale and probability vocabulary
The This is a scale between 0 and 1. 0 means the event is impossible.1 means the event is certain. can be labelled in fractions, decimals or percentages.
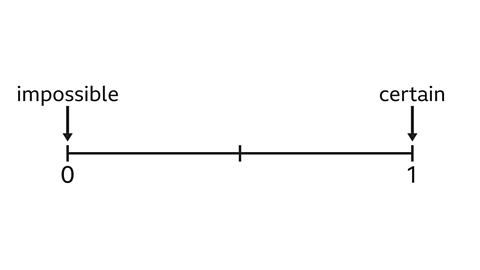
The scale goes from 0 to 1 (0% to 100%).
- An impossible event has a probability of 0 (0%).
- A certain event has a probability of 1 (100%).
- Other events have probabilities between 0 and 1.
The probabilities of event can be compared using their positions on the probability scale.
The vocabulary used in probability includes impossible, unlikely, even chance, likely and certain.
- These descriptions can help order the The chance that a particular outcome will occur. of a set of events.
The notation for the probability of an event is 𝑃(event).
The greater the proportion of times an event can happen, the greater, or more likely, the event.
Events can be ordered by the probability of them happening and how likely each event is.
Look back at how to describe probabilities and the probability scale to refresh your understanding of the probability scale and the vocabulary of probability.
Find out more below
GCSE exam-style questions

- A nut snack box contains only almonds and cashews.
The scale shows the probability of picking an almond from the box.
Decide whether each statement below is true or false, or if there is not enough information to decide.
a) There are 25 almonds in the box.
b) Three-quarters of the nuts in the box are cashews.
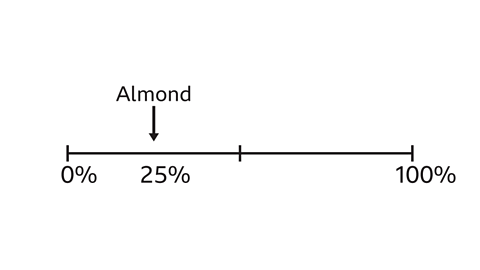
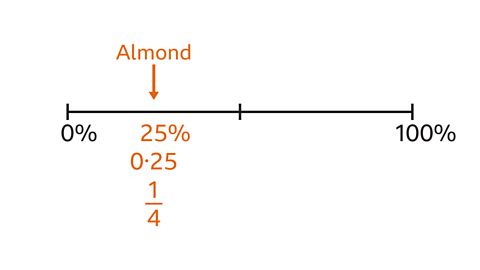
The probability scale shows that there is a 25% chance of picking an almond.
A quarter of the nuts are almonds.
There are only almonds and cashews in the box so if a quarter are almonds, three-quarters are cashews.
a) There are 25 almonds in the box.
This is false. There is not enough information to tell.
The number of nuts in the box is not given. There will be 25 almonds in the box if there are 100 nuts in total.
b) Three quarters of the nuts in the box are cashews.
This is true.
25% of the nuts are almonds, which is one quarter.
They are either almonds or cashews: 25% are almonds and 75% of the nuts are cashews, which is three-quarters.
- Three bags, X, Y and Z, contain counters.
The counters are either orange or blue.
A counter is picked at random from a bag.
Each scale shows the probability of picking one of the counters from a bag.
Which bag has the greatest proportion of orange counters?
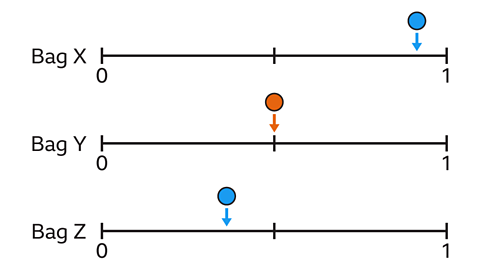
Bag Z has the greatest probability of an orange counter being picked.
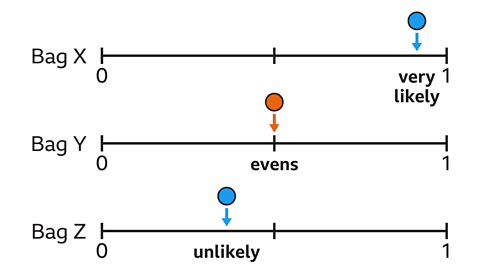
In bag X, 𝑃(blue) is very likely, so it is very unlikely that an orange counter will be taken from bag X.
In bag Y, 𝑃(orange) = \(\frac{1}{2} \) so half the counters are orange and half the counters are blue. There is an evens chance of each colour being picked.
In bag Z, 𝑃(blue) is unlikely. There is less than half a chance of a blue counter being picked. The chance of an orange counter being picked will be more than half, so it is likely that an orange counter is picked.
The largest proportion of orange counters are in bag Z so there is the greatest probability of picking an orange counter out of bag Z.
- A counter is taken from the bag.
Match each event to its correct position on the number line.
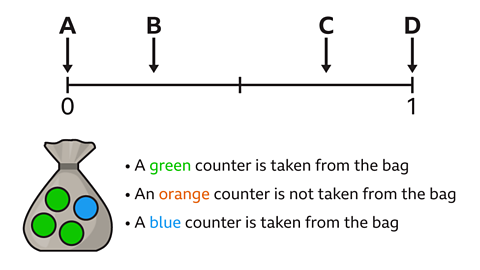
The probability scale shows four different events.
𝑃(event A) = 0, so event A is impossible.
𝑃(event B) = \(\frac{1}{4} \), 25% or 0·25.
𝑃(event C) = \(\frac{3}{4}\), 75% or 0·75.
𝑃(event D) = 1, so event D is certain.
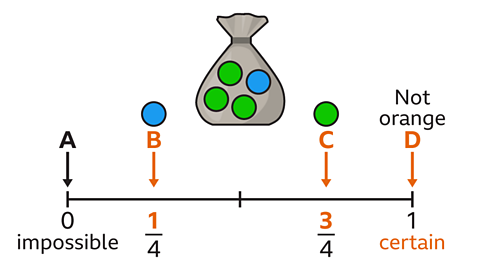
- A green counter is taken from the bag.
There are three counters out of the four counters. Three quarters of the counters are green.
𝑃(green) =\(\frac{3}{4} \), this is event C.
- An orange counter is not taken from the bag.
There are no orange counters in the bag. Taking an orange counter is impossible. Not taking an orange counter is certain. This is event D.
- A blue counter is taken from the bag.
There is one blue counter out of the four counters. A quarter of the counters are blue.
𝑃(blue) = \(\frac{1}{4} \), this is event B.
Find the probability of an event and the expected number of outcomes
The probability of an event can be written as a decimal, a percentage or a fraction.
- The Number written at the top of a fraction. The numerator is the number of parts used, eg for ⅓, the numerator is 1. is the number of A potential result. When a coin is tossed there are two possible outcomes: ‘heads’ or ‘tails’. When a standard dice is rolled there are six possible outcomes: 1, 2, 3, 4, 5 and 6. where the event happens.
- The Number written on the bottom of a fraction. The denominator is the number of equal parts, eg for ⅓, the denominator is 3. is the total number of outcomes.
\(𝑃(event) = \frac{number of outcomes where the event happens}{total number of outcomes} \)
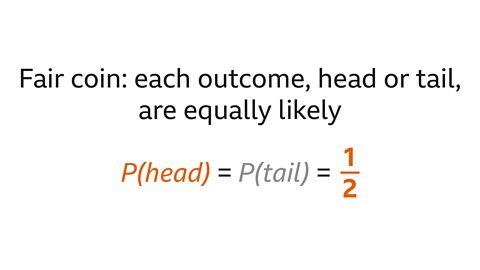
Outcomes are equally likely when they have the same probability.
- A When each outcome is equally likely the coin or spinner is fair. The probability of each outcome is the same. coin is equally likely to land on heads or on tails. The probability of tossing a head with a fair coin is \(\frac{1}{2} \).
This is called the 'theoretical probability'. In theory, if you toss a coin twice then one head is expected.
- A spinner that has more sectors coloured orange than blue will have a greater probability of landing on orange than on blue, the outcomes are not equally likely.
The expected number of outcomes is found by multiplying the probability of the event by the number of trials.
Follow the worked examples below
GCSE exam-style questions
- A fair coin is tossed several times.
The outcomes are shown below.
What is the probability that the next toss is a head?
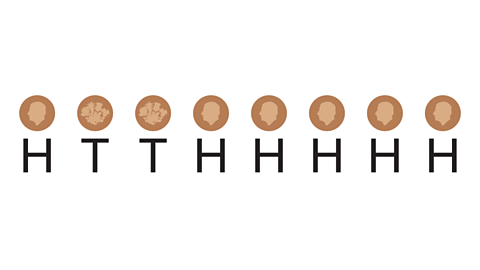
𝑃(head) = \(\frac{1}{2} \)
It does not matter how many times the fair coin has already been tossed, the outcomes (heads or tails) remain equally likely.
The probability that the next toss of the coin is a head is \(\frac{1}{2} \).
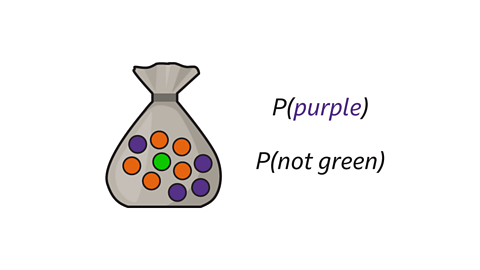
- A bag contains orange, green and purple counters as shown.
One counter is taken from the bag.
a) Find the probability that the counter is purple.
b) Find the probability that the counter is not green.
Give your answers as decimals.
a) 𝑃(purple) = 0·4
b) 𝑃(not green) = 0·9
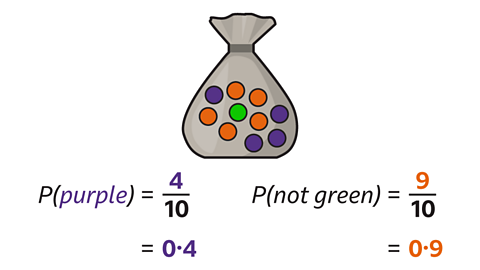
𝑃(purple) = \(\frac{2}{5} \)
𝑃(not green) = \(\frac{9}{10} \)
There are four purple counters in the bag, there are 10 counters in total.
𝑃(purple) is four tenths, this is 0·4 as a decimal.
𝑃(not green) is nine tenths, this is 0·9 as a decimal.
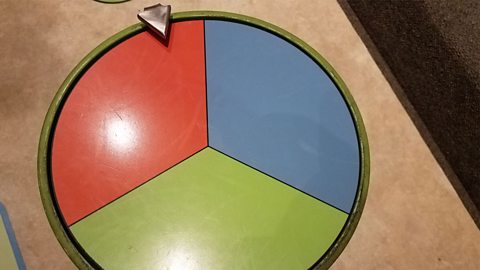
- The spinner is spun 20 times.
How many times is it expected to land on blue?
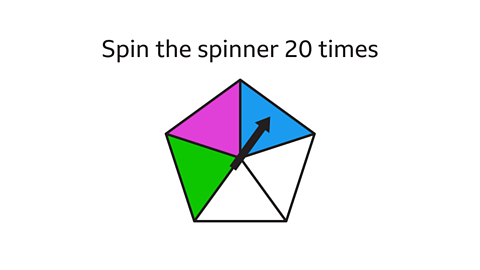
It is expected that the spinner will land on blue four times.
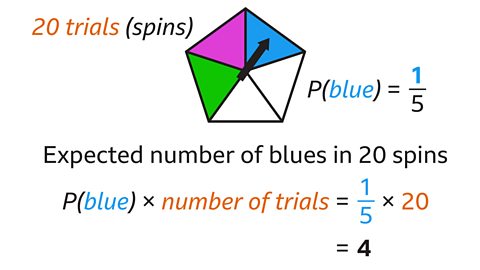
There are five sectors in total.
One of the equal sectors is coloured blue.
The probability of the spinner landing on blue is \(\frac{1}{5} \).
The spinner is expected to land on blue on fifth of the times it is spun.
Multiply 𝑃(blue) by the number of trials (number of spins), 20.
\(\frac{1}{5} \) × 20 = 4
Missing probabilities and mutually exclusive events
The The answer to addition problem. For example, the sum of 2, 3 and 7 is 12 (2 + 3 + 7 = 12) of the probabilities of all possible In probability, two or more events that cannot occur at the same time. For example, getting heads and tails in a coin toss or rolling a 5 and a 2 on a dice. The sum of the probabilities of all mutually exclusive outcomes is 1. outcomes for an event is 1.
The probability of an event not happening is 1 subtract the probability of the event happening.
Follow the worked examples below
GCSE exam-style questions
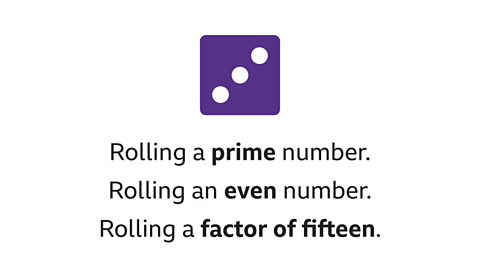
- A dice is rolled once.
Which of the listed outcomes are mutually exclusive?
The mutually exclusive events are rolling an even number and rolling a factor of 15.
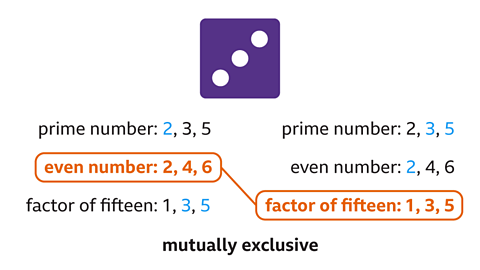
The prime numbers on a dice are 2, 3 and 5.
The even numbers on a dice are 2, 4 and 6.
The factors of 15 on a dice are 1, 3 and 5.
2 is a prime number and it is even so prime numbers and even numbers are not mutually exclusive.
3 and 5 are prime numbers and they are also factors of 15 so prime numbers and factors of 15 are not mutually exclusive.
The outcomes that do not occur at the same time are even numbers and factors of 15.
These outcomes are mutually exclusive.
- There are only blue, orange and green counters in a bag.
The table shows the probability of taking a blue counter from the bag at random.
There are an equal number of orange and green counters in the bag.
Find the missing probabilities.
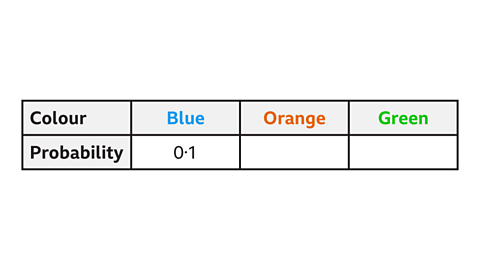
𝑃(orange) = 0·45
𝑃(green) = 0·45
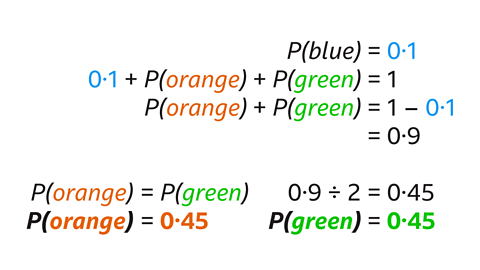
The probabilities of taking each counter add up to 1.
The probability of not taking a blue counter out of the bag is 1 – 0·1 = 0·9.
There are an equal number of orange and green counters in a bag, 𝑃(orange) and 𝑃(green) are equal.
0·9 ÷ 2 = 0·45
Quiz – Probability
Practise what you've learned about probability with this quiz.
Now you've revised probability, why not look at averages from a list of numbers?
More on Probability
Find out more by working through a topic
- count2 of 6
- count3 of 6
- count4 of 6

- count5 of 6