Key points about tree diagrams

A Shows outcomes and probabilities of combined events. is used to show all possible A potential result. When a coin is tossed there are two possible outcomes: ‘heads’ or ‘tails’. When a standard dice is rolled there are six possible outcomes: 1, 2, 3, 4, 5 and 6. for two or more A possible outcome, for example 'heads' when a coin is tossed..
The sum of the probabilities of all outcomes is 1.
Independent events are those not affected by a previous event. The probability of two independent events both happening is 𝑃(A and B) = 𝑃(A) × 𝑃(B).
Make sure you are confident in multiplying and adding fractions and decimals to work successfully with tree diagrams.
Check your understanding
How to complete a tree diagram to show outcomes and probabilities
Follow the steps below to draw a tree diagram for two or more events.
Draw a set of branches for the outcomes of the first event. Label each branch with the probability of each outcome.
Draw a set of branches for the outcome of the second event. Label each branch with the probability of each outcome.
Repeat step 2 for further events if needed.
Identify the outcomes by working across each set of branches.
Calculate the probabilities by multiplying the probabilities.
Check that the sum of probabilities of all outcomes is equal to 1.
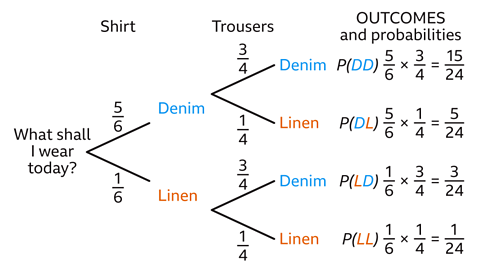
When working in fractions, do not simplify as this makes it easier to check that probabilities To add up. Sum 3, 5 and 8 means work out 3 + 5 + 8. to 1, and to add probabilities for combined events.
Follow the worked example below
GCSE exam-style questions

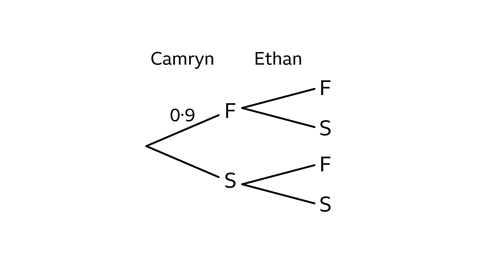
- The probability of Camryn swimming 25 m fast (F), taking less than 30 seconds, is 0·9.
The probability of Ethan swimming 25 m slowly (S), taking more than 30 seconds, is 0·8.
a) Complete the tree diagram to show all the outcomes for Camryn and Ethan swimming 25 m.
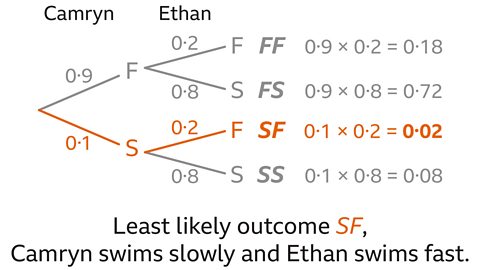
b) Use the tree diagram to find the least likely outcome.
The least likely outcome is SF, Camryn swims slowly and Ethan swims fast.
For Camryn 𝑃(F) = 0·9 and 𝑃(S) = 0·1 (1 – 0·9).
For Ethan 𝑃(S) = 0·8 and 𝑃(F) = 0·2 (1 – 0·8).
These values are written on the branches of the tree diagram.
The outcomes are both swim fast (FF), Camryn swims fast and Ethan swims slowly (FS), Camryn swims slowly and Ethan swims fast (SF) or both swim slowly (SS).
Calculate the probability of each outcome by multiplying the probabilities of the individual outcomes.
FF = 0·9 × 0·2 = 0·18
FS = 0·9 × 0·8 = 0·72
SF = 0·1 × 0·2 = 0·02
SS = 0·1 × 0·8 = 0·08
The least likely outcome is SF where Camryn swims slowly and Ethan swims fast.
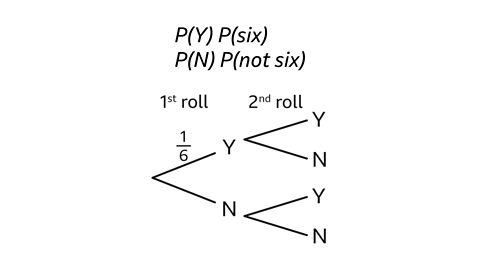
- A fair dice is rolled twice.
a) Complete the tree diagram.
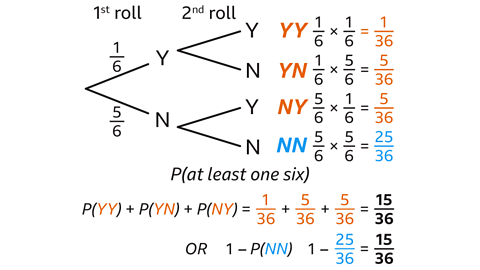
b) Find the probability that at least one six is rolled.
𝑃(at least one six) = \(\frac{11}{36} \)
When a fair dice is rolled either there is a six or there is not.
For a fair dice 𝑃(Y) = \(\frac{1}{6} \) and 𝑃(N) = \(\frac{5}{6} \).
The tree diagrams shows four outcomes: YY, YN, NY, NN.
The probability that there is at least one six is
𝑃(YY or YN or NY).
This is 𝑃(YY) + 𝑃(YN) + 𝑃(NY).
\(\frac{1}{36} \) + \(\frac{5}{36} \) + \(\frac{5}{36} \) = \(\frac{11}{36} \)
This can also be calculated by subtracting the probability of no sixes from 1.
1 – 𝑃(NN)
1 – \(\frac{25}{36} \) = \(\frac{11}{36} \)
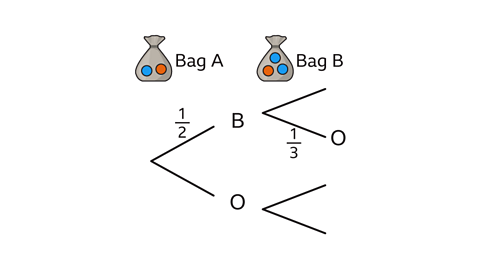
- A counter is taken from each bag.
a) Complete the tree diagram and list all possible outcomes and their probabilities.
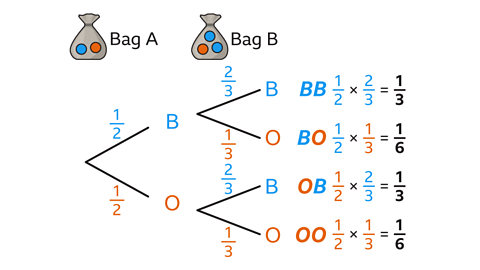
b) Calculate the probability of 𝑃(OO).
𝑃(OO) is = \(\frac{1}{6} \)
The counter taken from bag A is either blue or orange.
𝑃(B) = \(\frac{1}{2} \) and 𝑃(O) = \(\frac{1}{2} \).
The counter taken from bag B is either blue or orange 𝑃(B) = \(\frac{2}{3} \) and 𝑃(O) = \(\frac{1}{3} \).
The tree diagram shows four outcomes: BB, BO, OB and OO.
Multiply the separate probabilities along the branches to find the probability of each outcome.
𝑃(BB) = \(\frac{1}{2} \) × \(\frac{2}{3} \) = \(\frac{1}{3} \)
𝑃(BO) = \(\frac{1}{2} \) × \(\frac{1}{3} \) = \(\frac{1}{6} \)
𝑃(OB) = \(\frac{1}{2} \) × \(\frac{2}{3} \) = \(\frac{1}{3} \)
𝑃(OO) = \(\frac{1}{2} \) × \(\frac{1}{3} \) = \(\frac{1}{6} \)
What are independent and dependent events?
Two events are independent or dependent.
- A pair of events is independent if the probability of the first event happening does not affect the probability of the second event happening.
For example, the probability of flipping a head on a coin does not affect the probability of flipping a head next time. The results of flipping a coin are independent.
- A pair of events is dependent where the outcome of the first event affects the probability of the second event occurring. This happens when an item that is taken is not replaced.
For example, when two sweets are taken from a box containing a mix of chocolates and toffees, the probability of the second sweet being a chocolate is affected by which type of sweet was taken out of the box first.
Follow the worked examples below
GCSE exam-style questions
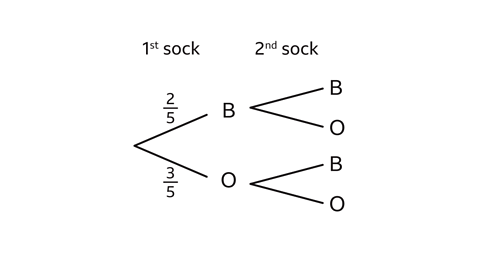
- A drawer contains two blue and three orange socks.
Two socks are taken from the drawer.
a) Decide whether the events are independent or dependent.
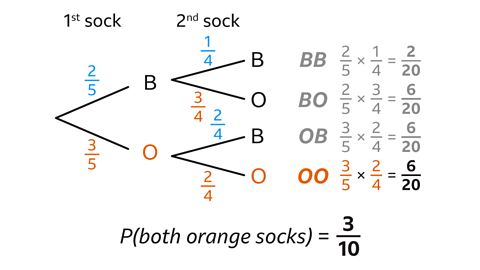
b) Complete the tree diagram and find the probability that two orange socks are taken out.
The events are dependent.
𝑃(OO) = \(\frac{3}{10} \)
The socks are dependent as the first sock taken affects the probability of the colour of the second sock.
When one sock is taken out, four socks remain.
If a blue sock is taken out, there is one blue sock left.
𝑃(B) = \(\frac{1}{4} \)
There are three orange socks so 𝑃(O) = \(\frac{3}{4} \).
If an orange sock is taken first, there are two blue socks left.
𝑃(B) = \(\frac{2}{4} \)
There are two orange socks left so 𝑃(O) = \(\frac{2}{4} \).
Work out the probability of taking two orange socks by multiplying \(\frac{3}{5} \) by \(\frac{2}{4} \).
𝑃(OO) is \(\frac{6}{20} \) which simplifies to \(\frac{3}{10} \).
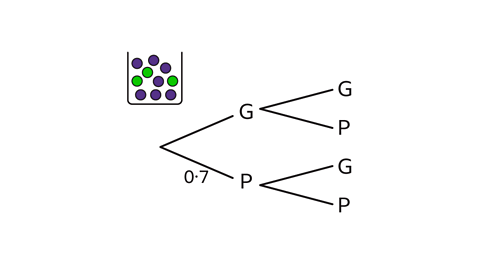
- There are green and purple counters in the box.
One counter is taken, its colour noted, and it is returned to the box.
Then a second counter is taken.
Complete the tree diagram and find the probability that two counters of different colours are taken.
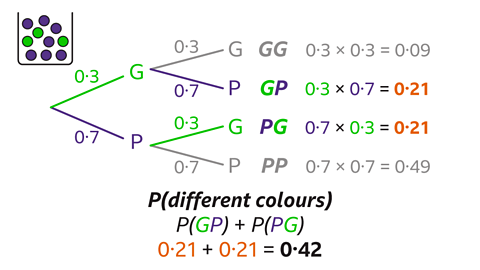
The probability that the two counters are different colours is 0·42.
The probability of taking a green counter is 0·3.
The probability of taking a purple counter is 0·7.
The first counter is returned to the box and a second counter is taken.
This means that the probability stays the same.
The events are independent.
The probability that the two counters are different colours is 𝑃(GP or PG).
𝑃(GP) = 0·3 × 0·7 = 0·21
𝑃(PG) = 0·7 × 0·3 = 0·21
𝑃(GP or PG) = 0·21 + 0·21 = 0·42
Tree diagrams – interactive activity
This interactive activity will help you understand the impact on probabilities of outcomes, by selecting different numbers of balls and choosing whether they are replaced or not after selection.
When do you multiply or add combined probabilities?
In probability, the way you combine two events depends on whether you want both to happen or either one or the other to happen.
Independent events
Independent events are events where the outcome of one does not affect the outcome of the other. For example, flipping a coin and rolling a dice are independent.
Find the probability of both event A and event B happening, by multiplying their probabilities.
𝑃(A and B) = 𝑃(A) × 𝑃(B)
Mutually exclusive events
Mutually exclusive events are events that cannot happen at the same time. For example, a single roll of a dice cannot result in both a 3 and a 5.
Find the probability of either event A or event B happening by adding their probabilities.
𝑃(A or B) = 𝑃(A) + 𝑃(B)
These calculations can be carried out without using a tree diagram.
It is particularly useful for repeated events such as flipping a coin five times.
Follow the worked examples below
GCSE exam-style questions
- The probability of rolling a six with a biased dice is 0·4.
Find the probability that three sixes are rolled.
𝑃(6, 6, 6) = 0·064
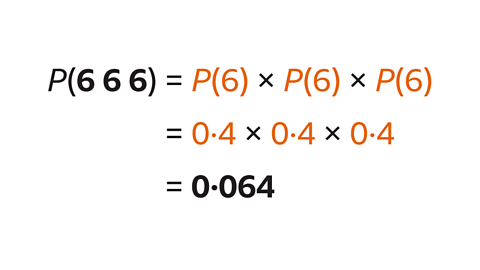
The probability of rolling a six is not affected by the score on previous rolls, the outcomes are independent.
The probability of three sixes is 𝑃(6) × 𝑃(6) × 𝑃(6).
0·4 × 0·4 × 0·4 = 0·064
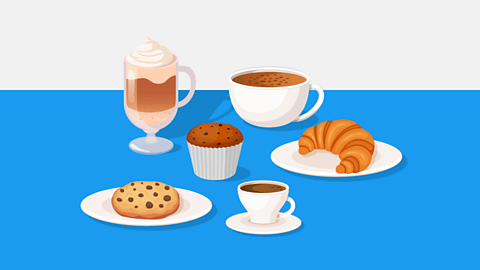
- Scarlett visits a coffee shop.
She orders a drink and a snack.
The probability that she orders a latte is 0·3, a cappuccino is 0·5 and an espresso is 0·2.
The probability that she orders a croissant is 0·7, a cookie is 0·1 and a muffin is 0·2.
Find the probability that she orders a latte and a croissant or a cappuccino and a muffin.
0·31
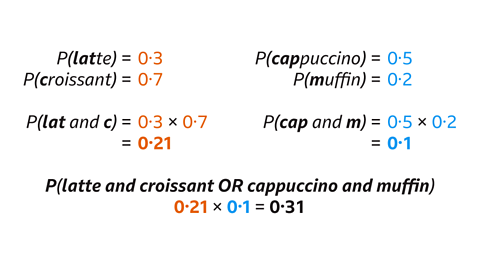
The events of choosing a drink and choosing a snack are independent, they do not affect each other.
The probability that Scarlett orders a latte and a croissant is 𝑃(latte) × 𝑃(croissant).
0·3 × 0·7 = 0·21
The probability that Scarlett orders a cappuccino and a muffin is 𝑃(cappuccino) × 𝑃(muffin).
0·5 × 0·2 = 0·1
The probability that she orders a latte and a croissant, or a cappuccino and a muffin, is the sum of these probabilities.
0·21 + 0·1 = 0·31
- The probability of flipping a head with a biased coin is 0·1.
The coin is flipped twice.
Find the probability of getting either two heads or two tails.
𝑃(HH or TT) = 0·82
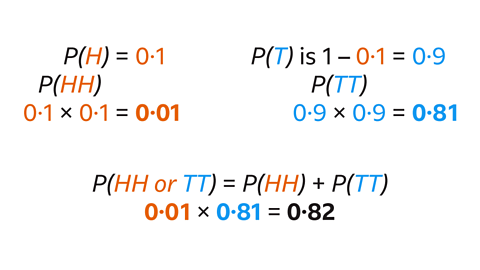
Each flip of the coin is not affected by the other flips, the events are independent.
The probability of getting two heads (HH) or two tails (TT) is 𝑃(HH) + 𝑃(TT).
𝑃(HH) = 0·1 × 0·1 = 0·01
𝑃(TT) = 0·9 × 0·9 = 0·81
𝑃(HH or TT) = 0·01 × 0·81 = 0·82
Quiz – Tree diagrams
Practise what you've learned about tree diagrams with this quiz.
Higher – What is conditional probability?
A conditional probability is the probability of something happening, given that something else has already happened.
For example, the probability of being picked for a sports team is more likely if training has been done beforehand.
The probability of having a temperature, given that you have the flu, is a conditional probability because having the flu makes it more likely to have a temperature.
Conditional probability happens when probabilities change.
It might be seen in the following types of problems.
Tree diagrams – In 'without replacement' problems. For example, if you take a counter from a bag and don't put it back, the probabilities for the next pick will change.
Two-way tables – For example, finding the probability that a student plays football, given that they are over 18.
Venn diagrams – For example, finding the probability that a number is a multiple of 3, given that it is already inside the circle for even numbers.
Follow the worked examples below
i) Completing a tree diagram given the probabilities of final outcomes
ii) Using conditional probabilities on a tree diagram
iii) Finding conditional probabilities from a tree diagram
GCSE exam-style questions
- There are five green marbles and three purple marbles in a bag.
Two marbles are taken out.
The tree diagram is only partially drawn.
Use the completed diagram to find the probability that two purple marbles are taken.
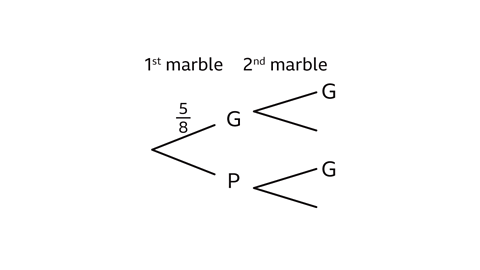
𝑃(PP) = \(\frac{3}{28} \)
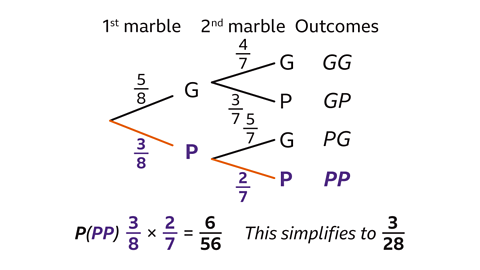
The probability of the first marble being purple is
1 – \(\frac{5}{8} \) = \(\frac{3}{8} \).
The denominator for the probability of the second marble is 7 because there is one less marble in the bag.
If a green marble was taken first, then the probability for the second marble 𝑃(G) is \(\frac{4}{7} \) and 𝑃(P) is \(\frac{3}{7} \).
If a purple marble was taken first, then the probability for the second marble, 𝑃(G) is \(\frac{5}{7} \) and 𝑃(P) is \(\frac{2}{7} \).
The probability of picking two purple marbles, 𝑃(PP) is
\(\frac{3}{8} \) × \(\frac{2}{7} \) = \(\frac{6}{56} \) which simplifies to \(\frac{3}{28} \).
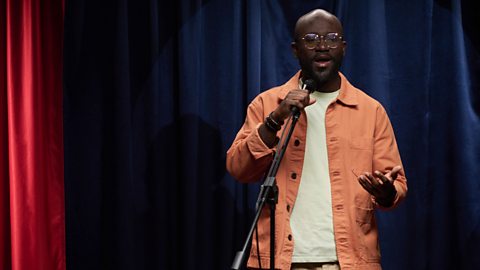
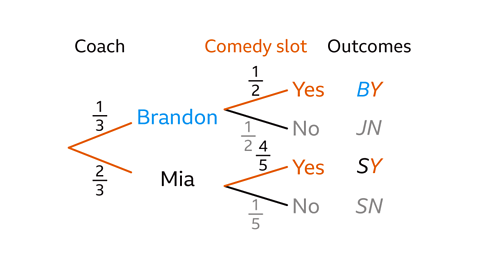
- The tree diagram shows the probabilities of aspiring stand-up comedians being coached by two different comics and the probability of getting a slot to perform at a comedy event.
Find the probability that someone who gets a place at the comedy event was coached by Brandon.
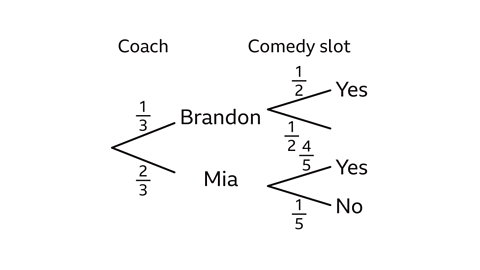
\(\frac{5}{21} \)
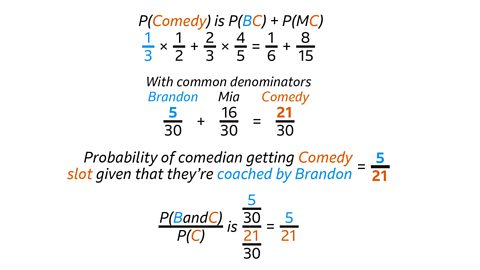
The probability that the aspiring comedian gets an event slot is 𝑃(BY or MY).
\(\frac{1}{6} \) + \(\frac{8}{15} \)
Write each fraction with a common denominator.
\(\frac{5}{30} \) + \(\frac{16}{30} \) = \(\frac{21}{30} \)
There are 21 ways of getting a slot at the comedy event, 5 of these are when Brandon coaches and 16 when Mia coaches.
The probability that the comedian gets a slot when Brandon has coached is \(\frac{5}{21} \).
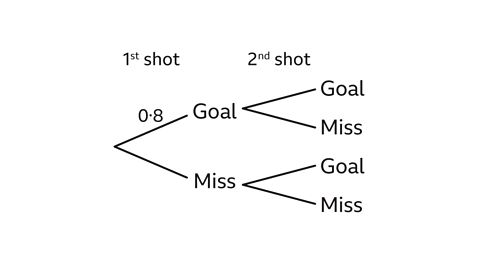
- The football team is practising their penalty shots.
Each person has two penalty shots.
The probability that Finn scores with his first shot is 0·8.
If he scores with his first shot, the probability that he scores with his second shot increases by 0·1.
If he doesn't score with his first shot, the probability that he scores with his second shot decreases by 0·1.
Complete the tree diagram and use it to find the probability that Finn scores only one of his two penalty shots.
0·22
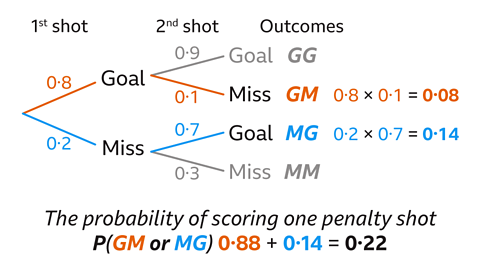
The probability that Finn scored with his first shot is 0·8.
𝑃(miss) with his first shot is 1 – 0·8 = 0·2.
If he scores with his first shot, the probability that he scores with his second shot increases by 0·1, so the probability that his second shot is 𝑃(goal) is 0·9 and 𝑃(miss) is 0·1.
If he doesn't score with his first shot, the probability that he scores with his second shot decreases by 0·1.
𝑃(goal) with his second shot is 0·7 and 𝑃(miss) with his second shot is 0·3.
The probability that he scores one goal from two shots is 𝑃(GM or MG).
𝑃(GM) = 0·8 × 0·1 = 0·08
𝑃(MG) = 0·2 × 0·7 = 0·14
𝑃(GM or MG) = 0·08 + 0·14 = 0·22
Higher – Quiz – Tree diagrams
Practise what you've learned about tree diagrams with this quiz for Higher tier.
Now you've revised tree diagrams, why not look at frequency tables, charts and diagrams?
More on Probability
Find out more by working through a topic
- count5 of 6
- count1 of 6
- count2 of 6