Key points about Venn diagrams

Use A diagram used to sort data. to find the probability of events, using the number of A piece of information or a letter, or a number, in a set. Also described as a member of the set. in regions from the numerator and denominator. The notation for 'the number of elements in set A' is 𝑛(𝐴).
When calculating the probability of an event, the number of elements in the relevant region and the total number of elements in the universal set, 𝑛(𝜉), must be known. For example, the probability of event A, 𝑃(A) = \(\frac{𝑛(𝐴)}{𝑛(𝜉)} \)
The probability of an event not happening uses the On a Venn diagram, the region of two or more sets when they are combined. PᴜQ is the union of set P and set Q. of the region on the Venn diagram. For example, 𝑃(A') = \(\frac{𝑛(𝐴')}{𝑛(𝜉)} \)
Organising data into a Venn diagram is useful in solving probability problems.
Improve your confidence in this topic further by looking at these other guides on sets and Venn diagrams.
Check your understanding
Understanding set notation in the context of probability
Probability from Venn diagrams is usually written as a fraction.
The number of elements in different An identified area on a diagram or graph. are the Number written at the top of a fraction. The numerator is the number of parts used, eg for ⅓, the numerator is 1. and Number written on the bottom of a fraction. The denominator is the number of equal parts, eg for ⅓, the denominator is 3. of the fractions.
The number of elements in the The set of all the elements being considered. The Greek letter Xi (ξ) is used. is represented by 𝜉, and the denominator of the fraction is often written as 𝑛(𝜉).
𝑃(A) represents the probability of event A, the numerator is 𝑛(A), the number of elements in A collection of information or letters or numbers. The members of the set can be listed inside curly brackets,{}. A set may be described in words inside curly brackets {}. On a Venn diagram a set is shown as a circle. A.
𝑃(A') represents the probability of event not A, the numerator is 𝑛(A'), the number of elements in the complement of set A.
𝑃(B) represents the probability of event B, the numerator is 𝑛(B), the number of elements in set B.
𝑃(A∩B) represents the probability of A and B, the numerator is 𝑛(A∩B), the number of elements in the intersection of set A and set B.
𝑃(A∪B) represents the probability of A or B or both, the numerator is 𝑛(A∪B), the number of elements in the union of set A and set B.
Calculating the probability of an event from a Venn diagram
- If necessary, draw the Venn diagram to show the number of elements in each region.
- Find the number of elements in the region that represents the event, this is 𝑛(event).
- Find the total of elements, this is 𝑛(𝜉).
- Divide the number of elements by the total number of elements.
Find out more below, along with a worked example
GCSE exam-style questions

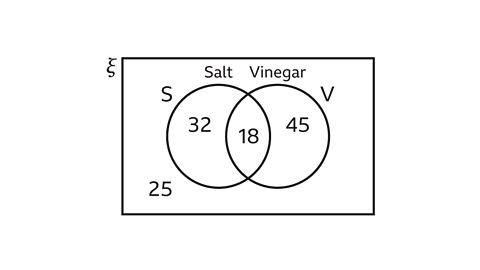
- A group of people are asked whether they like to put salt on their chips and whether they like to put vinegar on their chips.
The Venn diagram shows the results.
a) Work out the number of people who were asked.
b) Calculate the probability that a person chosen at random does not put salt or vinegar on their chips.
120 people
𝑃(not salt or vinegar) = \(\frac{25}{120} \) which can be simplified to \(\frac{5}{24} \).
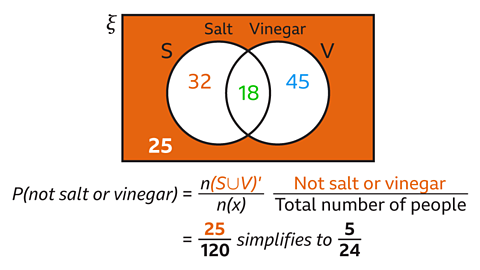
The total number of people, 𝑛(𝜉) is 25 + 32 + 18 + 45 = 120.
The number of people who do not put salt or vinegar on their chips is 𝑛(SᴜV)' is 25.
The probability that a person chosen at random does not put salt or vinegar on their chips is all the people outside the two sets, (25), divided by the total number of people (120).
𝑃(not salt or vinegar) = \(\frac{25}{120} \) which can be simplified to \(\frac{5}{24} \).
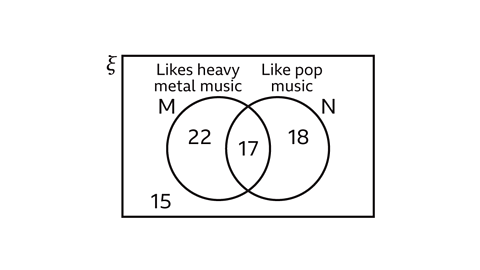
- The Venn diagram shows sets M and N.
The diagram gives the number of people who like heavy metal music (set M) and the number of people who like pop music (set N).
Work out 𝑃(N').
𝑃(N') = \(\frac{37}{72} \)
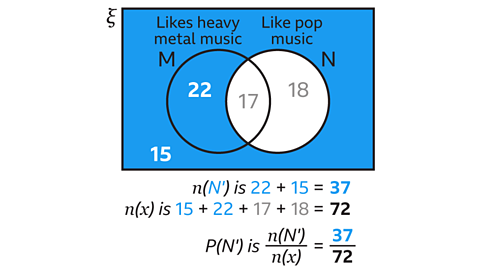
𝑃(N') is the probability that a person chosen at random does not like pop music.
N' is all the people outside of set N.
𝑛(N') is 22 + 15 = 37.
The total number of people is 15 + 22 + 17 + 1.
𝑛(𝜉) = 72
𝑃(N') = \(\frac{37}{72} \)
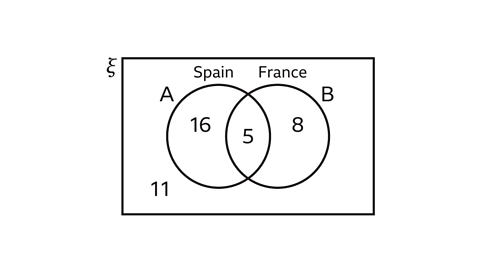
- The Venn diagram shows the results of a survey about holiday destinations.
The people in group A visited Spain.
The people in set B visited France.
A person is chosen at random, work out 𝑃(A∪B).
𝑃(A∪B) = \(\frac{29}{40}\)
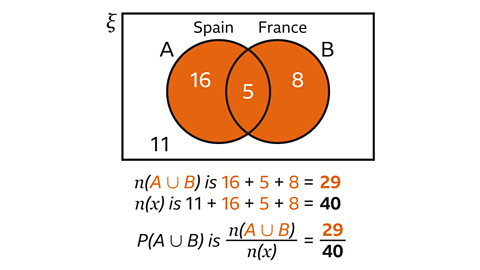
A∪B is the union of set A and set B.
These are the people who have been to Spain or France or both.
𝑃(A∪B) is 𝑛(A∪B), 16 + 5 + 8 = 29, divided by the total number of people, 𝑛(𝜉) = 40.
𝑃(A∪B) = \(\frac{29}{40}\)
How to create and interpret Venn diagrams
Draw a Venn diagram with two sets A and B.
- Identify which elements belong to the the intersection of sets A and B.
- Fill in the remaining unique elements for each set and the universal set.
To avoid errors:
- make sure that the number of elements in the Venn diagram is equal to the number of elements in the universal set
- check that a set does not include an element that is not in the universal set
Follow the worked example below
GCSE exam-style questions
- 80 people visit an adventure park.
30 people play mini golf and complete the escape room.
15 people just play mini golf.
10 people didn't play mini golf or complete the escape room.
a) Complete the Venn diagram to show this information.
b) How many people only completed the escape room?
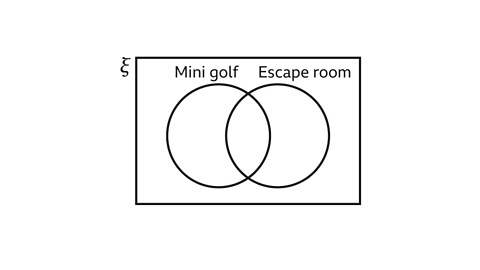
25 people only completed the escape room.
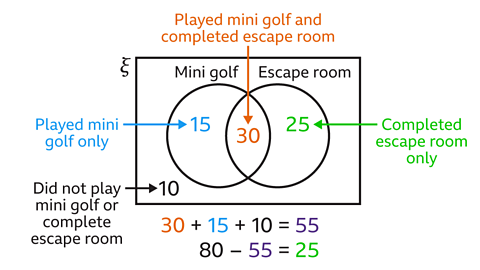
Place 30 in the intersection (overlap) as 30 people played mini golf and completed the escape room.
Write 15 in the region that is inside the circle for mini golf but not the intersection as 15 people played mini golf.
Write 10 in the region inside the rectangle, outside the circles as 10 people didn't play mini golf or complete the escape room.
Work out the number of people who just completed the escape room by adding all the numbers used so far and subtracting them from 80 which is the total number of people.
30 + 15 + 10 = 55
80 – 55 = 25
25 people completed the escape room only.
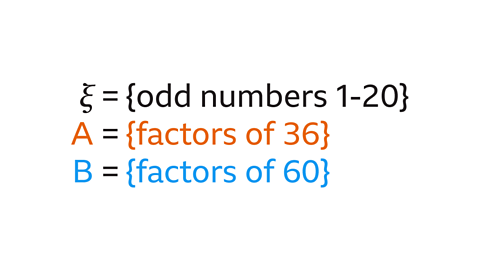
- 𝜉 = {odd number from 1 to 20}
A is the set of factors of 36.
B is the set of factors of 60.
a) Complete the Venn diagram.
b) List the elements of A∪B.
1, 3, 5, 9 and 15
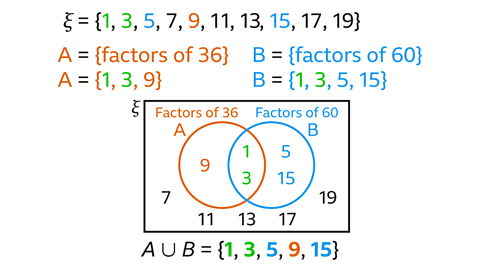
- Write each set as a list of elements.
A is the set of odd factors of 36 which are under 20.
A = {1, 3, 9}
B is the set of odd factors which are under 20.
B = {1, 3, 5, 15}
The sets overlap.
Write the elements that are in both sets (1 and 3) in the intersection A∩B.
Write the rest of the elements that are just in set A in the circle for A but not in the overlap (9).
Write the rest of the elements that are just in set B in the circle for B but not in the overlap (5 and 15).
Write the remaining numbers in the universal set
(7, 11, 13, 17 and 19) in the region inside the rectangles and outside the circles.
The Venn diagram is now complete.
The elements in A∪B inside A and B and the overlap are 1, 3, 5, 9 and 15.
Using Venn diagrams to solve problems
Problems based on a given Venn diagram can be linked to different things.
Writing all outcomes systematically in a logical order. the elements of a region described in set An agreed form of presentation for mathematical information..
Working out the probability of a region described in set notation. This is the number of elements in that region divided by the number of elements in the universal set.
Solve problems by completing a Venn diagram to organise all the given information.
Fill in the information that goes into exact regions.
Work out any missing values.
Use the completed diagram to solve the problem.
Follow the worked examples below
i) Listing elements in given regions
ii) Complete a Venn diagram to solve a problem
GCSE exam-style questions
- 𝜉 = {integers 1 to 10}
A = {factors of 30}
B = {factors of 40}
a) Complete the Venn diagram.
b) List the elements in (A∪B)' and work out 𝑃(A∪B)'.
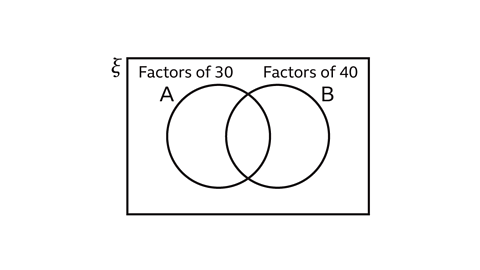
(A∪B)' = {7,9}
𝑃(A∪B)' = \(\frac{2}{10} \), this simplifies to \(\frac{1}{5} \).
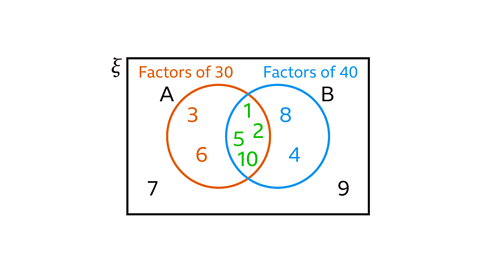
The factors that are common to 30 and 40 are 1, 2, 5 and 10.
Write these in the intersection A∩B.
3 and 6 are factors of 30 but not 40. Write them in the circle for factors of 30 but not in the intersection.
4 and 8 are factors of 40 but not 30. Write them in the circle for factors of 40 but not in the intersection.
7 and 9 are not factors of either 30 or 40. Write them in the rectangle outside of the circles.
The elements in (A∪B)' are inside the rectangle and outside the circles, so they are all the elements not in the union of A and B.
(A∪B)' = {7,9}
This is the shaded region of the diagram.

𝑃(A∪B)' is the number of elements in (A∪B)', divided by the number of elements in 𝜉.
𝑃(A∪B)' = \(\frac{2}{10} \), this simplifies to \(\frac{1}{5} \).
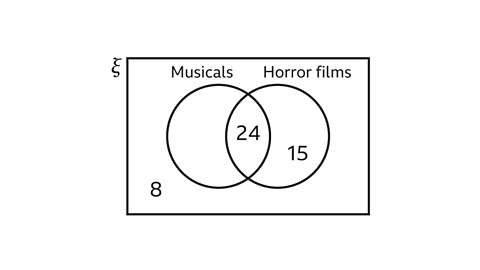
- 50 people were asked whether they like horror films, musicals or both.
The Venn diagram shows some of the results.
24 people like both horror films and musicals.
15 people only like horror films.
8 people do not like horror films or musicals.
Find out the number of people who like musicals.
27 people like musicals.
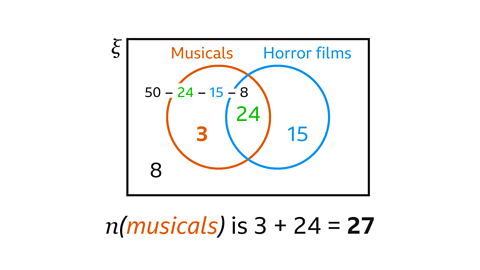
The total number of people is 50.
Three of the four regions are filled in.
The missing value is 50 – 24 – 15 – 8 = 3.
The number of people who only like musicals is 3.
The number of people who like musicals is 3 + 24 = 27.
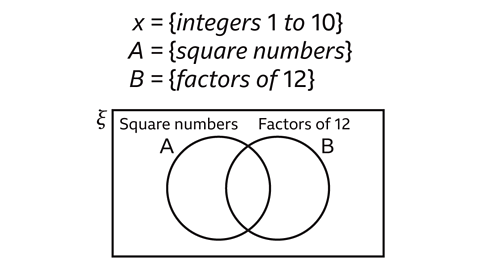
- 𝜉 = {integers 1 to 10}
A = {square numbers}
B = {factors of 12}
a) Complete the Venn diagram.
b) List the elements in B'.
B' = {5, 7, 8, 9, 10}
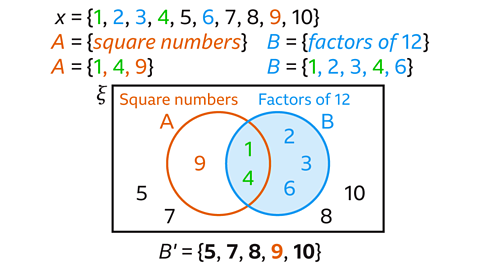
List the elements in each set:
- 𝜉 = {1, 2, 3, 4, 5, 6, 7, 8, 9, 10}
- A = {1, 4, 9}
- B = {1, 2, 3, 4, 6}
The elements in both sets are 1 and 4, and these are written in the intersection A∩B.
One square number (9) is not a factor of 12. Write 9 in the circle for A but not in the intersection.
Three of the factors of 12 are not square numbers (2, 3, 6). Write these numbers inside the circle for B but not in the intersection.
The numbers not used in the universal set, 𝜉, are (5, 7, 8, 10). Write these inside the rectangle and outside the circles.
The elements in B' are all the numbers that are not inside the circle for B.
B' = {5, 7, 8, 9, 10}
Quiz - Venn diagrams
Practise what you've learned about Venn diagrams with this quiz.
Now you've revised Venn diagrams, why not look at scatter graphs and time series?
More on Probability
Find out more by working through a topic
- count1 of 6
- count2 of 6
- count3 of 6