Key points about showing outcomes

A potential result. When a coin is tossed there are two possible outcomes: ‘heads’ or ‘tails’. When a standard dice is rolled there are six possible outcomes: 1, 2, 3, 4, 5 and 6. of an event(s) can be shown by:
- listing
- using a The sample space is the set of all possible outcomes. For a single event this can be a list of outcomes, written in set notation S = {…….}. For combined events this is usually presented in a table. The sum of all the probabilities for all the events in a sample space is 1.
- using a Used to record and organise information given as frequencies. This can then be used to calculate probabilities.
The chance of an event happening. The probability of an event has a value from 0 to 1 and is written as a fraction, a decimal or as a percentage. The notation for the probability of an event is 𝑃(event). can be worked out from data presented in different ways:
- as a list
- in a A way to organise the data of two specific (categorical) variables. Each cell gives the frequency of combined attributes.
- in a sample space diagram
- as a frequency tree
Working in a systematic and organised way will help in showing all the possible outcomes correctly.
Support your confidence in showing outcomes by revising listing probability of combined events and sample space diagrams.
Video – Frequency trees
Watch this video to find out how to use frequency trees to record and organise information given as frequencies.
Tom: What are frequency trees?
Imagine a company is researching which kind of video games students prefer, puzzles or adventures, and the type of device they play on, mobile phone or games console.
Misha prefers adventure games and plays on a games console.
Kory prefers puzzle games and plays on a mobile phone, and everyone else has their own preferences.
A frequency tree can be used to organise and display the frequencies for each outcome.
First, the 20 people who answered the survey are split into two branches: 12 who prefer puzzle games and 8 who prefer adventure.
Then, each branch splits again to show how many from each type use either a mobile phone or a games console.
Let's look at an example question.
30 musicians are performing at a festival.
18 are in a band, B, and the rest are solo artists, S.
Of those that are in a band,16 are playing on the main stage, M.
Of those that are solo artists, 4 are playing in a small room, R.
Okay, let's look at part A: draw a frequency tree to represent the data.
There are 30 musicians in total, so start with a circle containing 30
Then, draw two branches labelled B for band and S for solo.
You're told that 18 people are in a band.
That means the number of solo artists must be 30 subtract 18, which equals 12
Next, split each branch into two more branches, labelled M for main stage and R for small room.
Of the 18 people in a band, 16 are playing on the main stage.
That means the number from this group who are playing in a small room is 18 subtract 16, which equals 2, and of the 12 solo artists, 4 are playing in a small room, so the number of people from this group who are playing on the main stage is 12 subtract 4, which equals 8
Right. Let's look at part B.
Firstly, work out the probability that a randomly selected musician is a solo artist who is playing on the main stage.
Out of a possible 30 musicians, 8 are solo artists and are playing on the main stage.
So, the probability is 8 over 30, which simplifies to 4 over 15
Next, work out the probability that a randomly selected person is playing in a small room.
There are two parts of the frequency tree for small room.
2 add 4 equals 6 people playing in a small room in total, so the probability is 6 over 30, which simplifies to one fifth.
Remember, when you're faced with lots of frequency data, organise it into branches in frequency trees so that you can interpret all the different categories.
Check your understanding
How to list outcomes
Working with a logical and organised approach helps in making sure that all the outcomes are found.
Representing an outcome, such as a colour by a single letter, can make Writing all outcomes systematically in a logical order. faster, for example yellow = Y.
Listing outcomes of a single event
Write the outcomes in a logical, organised order. Arrange them alphabetically or numerically.
Write the outcomes as a list or presented in set An agreed form of presentation for mathematical information. 𝑆 = {…} where each possible outcome is written once.
Listing outcomes of two or more events (combined events)
For a pair of combined events, take the following steps.
Start with one event. Write down one of its outcomes paired with each outcome of the second event.
For the same event, write down another of its outcomes paired with each outcome of the second event.
Repeat until all the outcomes of the first event have been paired with each outcome of the second event.
Where there are three or more events, it is essential to follow a logical approach to make sure all outcomes are listed.
The probability of the event(s) can be written as a fraction where:
the Number written on the bottom of a fraction. The denominator is the number of equal parts, eg for ⅓, the denominator is 3. is the total number of possible outcomes
the Number written at the top of a fraction. The numerator is the number of parts used, eg for ⅓, the numerator is 1. is the number of times the particular outcome occurs
it may be possible to simplify the fraction
Follow the worked examples below
i) Listing outcomes for a single event
ii) Listing outcomes for combined events
GCSE exam-style questions

- Write the outcomes for this spinner using set notation.
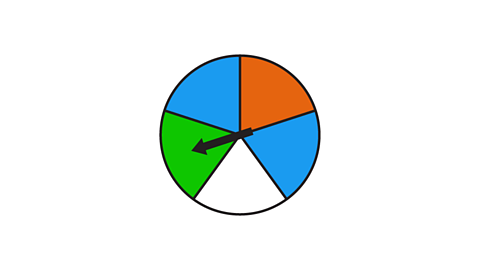
𝑆 = {blue, green, orange, white}
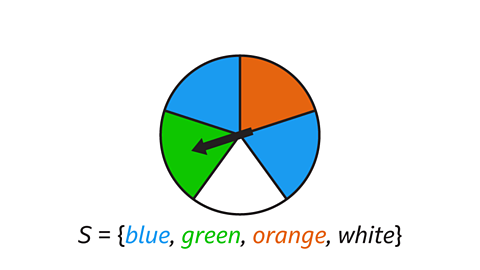
The colours on the spinner are blue, green, orange and white.
This gives us 𝑆 = { blue, green, orange, white} in set notation.
- List all the possible outcomes of flipping a coin twice.
HH, HT, TH, TT
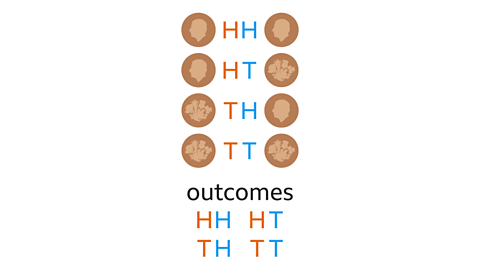
Write the list of outcomes systematically.
- The first flip could be heads (H), followed by the second flip of heads (H) or tails (T).
- The first flip could be tails (T), followed by the second flip of heads (H) or tails (T).
This gives four outcomes: HH, HT, TH and TT.
- Write all the possible outcomes of taking one coloured counter from each bag.
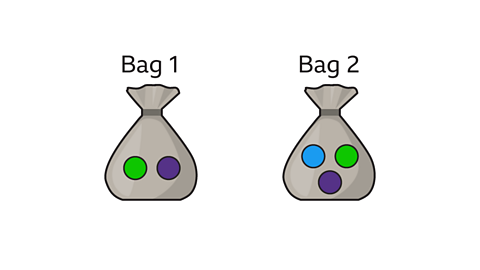
PB, PP, PG, GB, GP and GG
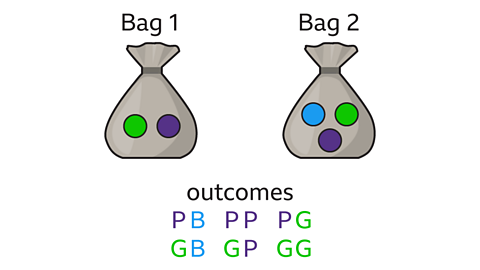
Write the list of outcomes systematically.
The counter taken out of bag 1 could be purple (P), followed by a counter taken from bag 2, blue (B), purple (P) or green (G).
The counter taken out of bag 1 could be green (G), followed by a counter taken from bag 2, blue (B), purple (P) or green (G).
This gives six outcomes: PB, PP, PG, GB, GP and GG.
How to construct sample space diagrams and find probabilities
The estimated probability of an event, calculated from a probability experiment or from collected data. are a visual way of recording the possible outcomes of two events, which can then be used to calculate probabilities.
A sample space diagram is a grid used to show all the outcomes of two combined events.
The dimensions of the grid can be multiplied to give the total number of outcomes.
This is the product rule.
How to construct a sample space diagram
Construct a grid, with dimensions showing the number of outcomes for one event, by the number of outcomes for the second event. The orientation of the grid makes no difference to the number of outcomes.
Label each side of the grid with the outcomes of each event. The cells of the grid are filled with the combined outcome. This may be the result of a calculation or written to represent a combination of events.
How to work out the probability
Work out the probability of the combined event as a fraction, using a sample space diagram.
- The Number written on the bottom of a fraction. The denominator is the number of equal parts, eg for ⅓, the denominator is 3. is the total number of possible outcomes.
- The Number written at the top of a fraction. The numerator is the number of parts used, eg for ⅓, the numerator is 1. is the number of times the particular outcome occurs.
- It may be possible to simplify the fraction.
Follow the worked example below
GCSE exam-style questions
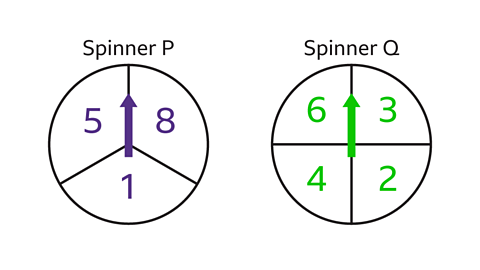
- Construct a sample space diagram for the results of twirling the two spinners, P and Q, and multiplying the numbers.
Find the probability of the product being an even number.
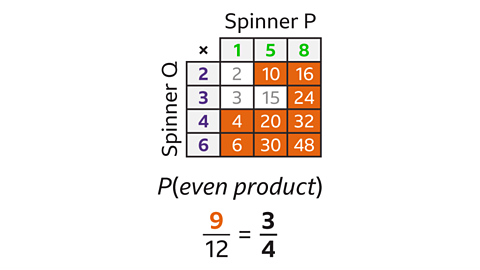
𝑃(even) = \(\frac{3}{4} \)
- Draw a grid labelled with the outcomes of spinner
P (1, 5, 8) and spinner Q (2, 3, 4, 6).
This gives a 3 by 4 or 4 by 3 grid.
3 × 4 = 12 and 4 × 3 = 12.
The total number of possible outcomes is 12 so the denominator of the fraction is 12.
- Fill the cells of the gird with the products of the numbers on spinner P and spinner Q.
The probability of the product being an even number is a fraction.
The products that are even are 4, 6, 10, 16, 20, 24, 30, 32 and 48.
There are 9 even numbers.
The numerator of the fraction is 9.
The probability that the sum is even is \(\frac{9}{12} \).
This can be simplified to \(\frac{3}{4} \).
𝑃 (even) = \(\frac{3}{4} \)
- Draw a sample space diagram to show all the possible outcomes of flipping a coin and rolling a dice.

H1, H2, H3, H4, H5, H6, T1, T2, T3, T4, T5 and T6
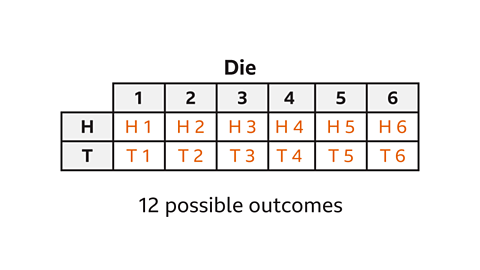
Draw a grid labelled with the outcomes of the coin (heads, H, and tails, T) and the dice (1, 2, 3, 4, 5 and 6).
Each cell shows an outcome for the two events.
There are 12 possible outcomes: H1, H2, H3, H4, H5, H6, T1, T2, T3, T4, T5 and T6.
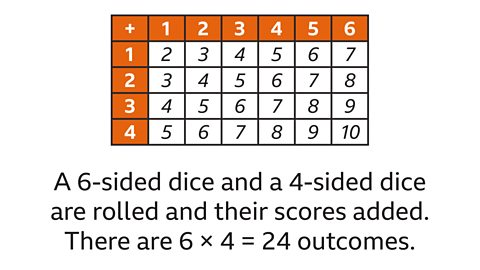
- Two 4-sided dice are rolled and the numbers added together.
Find the probability of rolling a multiple of 3 with two 4-sided dice using the sample space diagram.
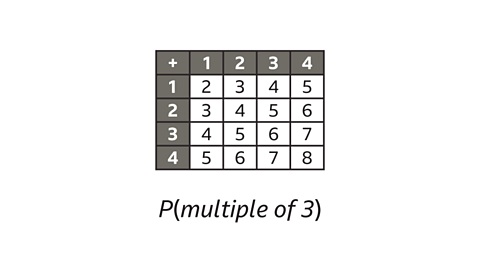
𝑃(multiple of 3) = \(\frac{5}{16} \)
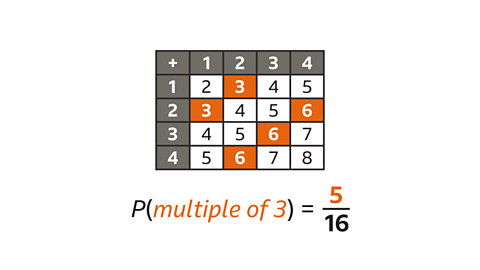
There are 16 outcomes in the 4 × 4 grid.
The denominator of the fraction is 16.
The multiples of three are 3 and 6.
There are 5 multiples of three in the grid.
The numerator of the fraction is 5.
The probability that the sum is a multiple of three, 𝑃(multiple of 3) = \(\frac{5}{16} \).
Theoretical probability outcomes – interactive activity
Using a sample space diagram, this interactive activity will help you see how the probabilities of the outcomes of two combined events can be calculated, and how they are not all equal.
How to use two-way tables to calculate probabilities
Two-way tables, represent the The number of times something occurs. of data about two A type of data variable that sorts observations into distinct groups, such as wearing glasses (or not), colour of hair or year groups..
The rows represent one variable and the columns represent another.
Each One space in a table or a grid. represents the frequency of A single piece of information or observation that represents a specific value within a larger set of data. that fit both variables.
A completed two-way table can be used to find the probability of specific events.
The total number of outcomes will be the sum of the frequencies of all categories being considered.
The numerator will be the sum of the frequencies relevant to the given event.
Follow the worked example below
GCSE exam-style questions
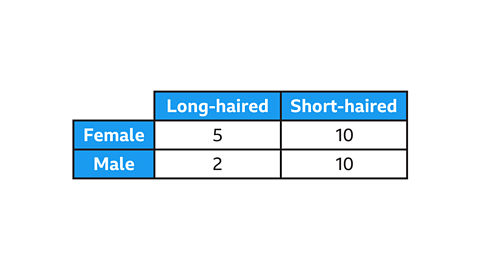
- The two-way table shows information about cats looked after by a cat shelter.
Find the probability that a cat chosen at random is female.
Give your answers in its lowest terms.
𝑃(female) = \(\frac{5}{9} \)
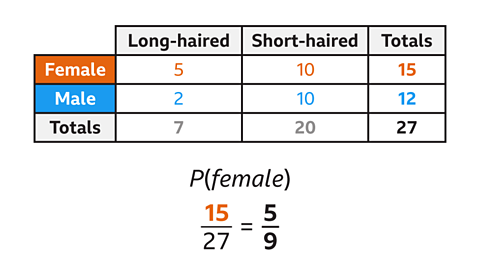
The probability that a female cat is chosen at random is a fraction.
The numerator is the total number of female cats (15).
The denominator is the total number of cats in the cat shelter (27).
𝑃(female) = \(\frac{15}{27} \)
Simplified to its lowest terms, this is \(\frac{5}{9} \).
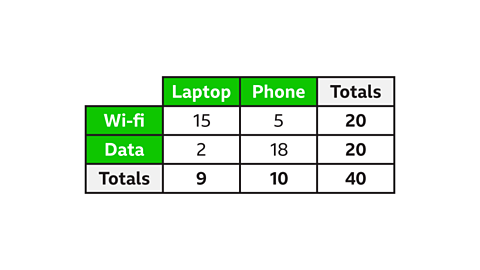
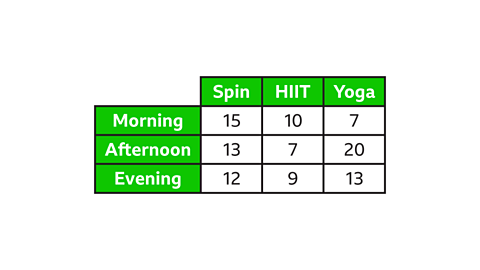
- The classes at a gym are shown in the two-way table.
No-one takes more than one class.
Find the probability that a person who takes a spin class does so in the morning.
𝑃(spin in the morning) is \(\frac{3}{8} \).
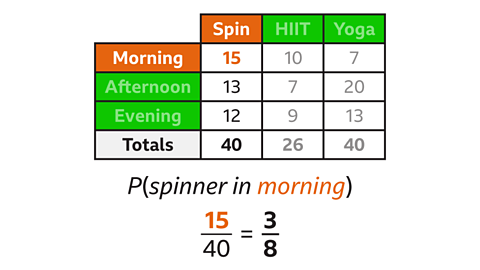
The probability that a person does spin in the morning is a fraction.
The numerator is the number of morning spinners (15).
The denominator is the total number of spinners (40).
𝑃(spin in the morning) is \(\frac{15}{40}\).
This simplifies to its lowest terms as \(\frac{3}{8}\).
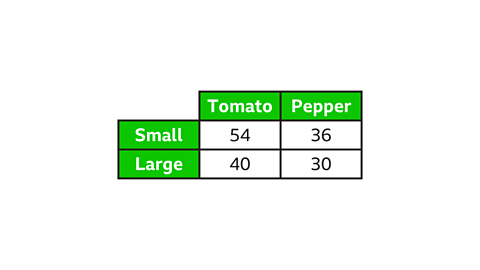
- The two-way table shows the sizes of tomato and pepper plants at a garden centre.
Find the probability that a plant picked at random is a small pepper plant.
𝑃(small pepper) = \(\frac{9}{40}\)
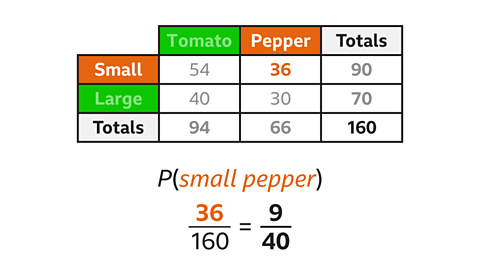
𝑃(small pepper) is a fraction.
The total number of plants is the denominator (160).
The number of small pepper plants is the numerator (36).
The probability that a small pepper plant is chosen at random is \(\frac{36}{160}\).
This simplifies to \(\frac{9}{40}\).
How to complete a frequency tree and calculate probabilities
A frequency tree is used to record and organise information given as frequencies.
This is used to calculate probabilities.
- Start with the total frequency.
- Split into two (or more) categories, label the branches and write the frequency of each.
- Split into further categories, label and enter frequencies as required.
Information might not be given as a frequency but as a proportion of either the whole group or a specific category.
Boost your confidence further by exploring working with proportions.
Follow the worked example below
GCSE exam-style questions
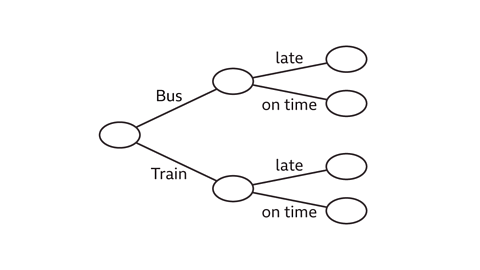
- 240 people travel to work by bus or by train.
The frequency tree shows how many people arrive late or on time to work.
There are 125 people who take the train.
108 of those who travelled by bus were on time.
Of the people who were late, one more travelled by train than on the bus.
Use the frequency tree to find the probability that a person is on time to work.
𝑃(on time) = \(\frac{15}{16} \)
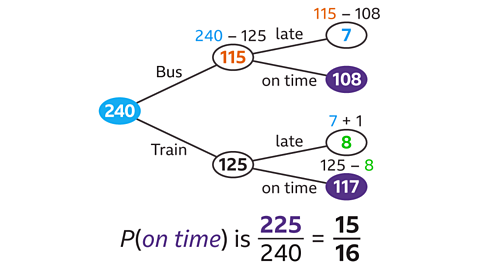
There are 240 people, enter this in the first bubble on the left.
There are 125 people who travel by train.
The number of people who travel by bus is
240 – 125 = 115.
108 of those who travelled by bus were on time, the number of bus travellers who were late is 115 – 108 = 7.
The number of people that travelled by train that are on time is 125 – 8 = 117.
The number of people who are on time is 108 + 117 = 225.
The probability that a person is on time to work is \(\frac{225}{240} \) which simplifies to \(\frac{15}{16} \).
- A hotel has 80 guest rooms: single, double and family rooms.
Some rooms have a shower and some have a bath.
Use the frequency tree to find the probability that a room selected at random has a shower.
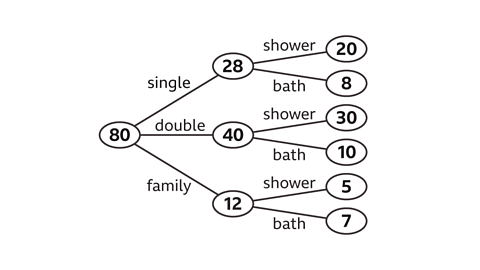
𝑃(shower) = \(\frac{11}{16} \)
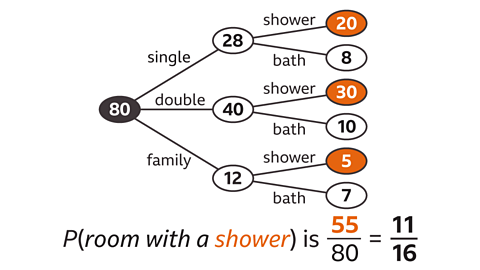
The number of rooms with a shower is 55.
20 + 30 + 5 = 55
The total number of rooms is 80.
The probability that a room chosen at random has a shower is \(\frac{55}{80} \) which simplifies to \(\frac{11}{16} \).
- A zoo has 20 big cats.
The ratio of lions to tigers is 3 : 2.
\(\frac{1}{3} \) of the lions and 25% of the tigers are male, the rest are female.
Find the probability that a big cat selected at random is female.
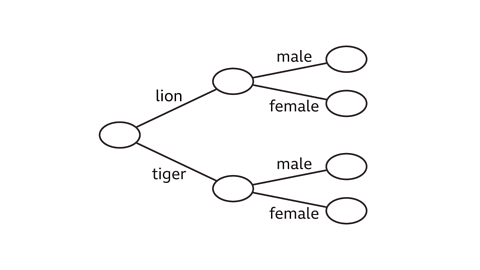
𝑃(female) = \(\frac{7}{10} \)
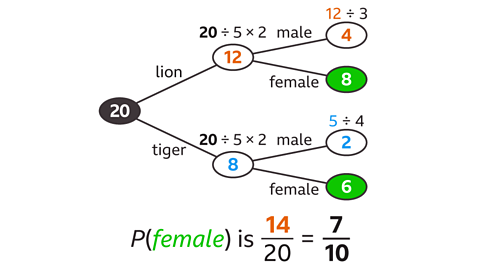
Divide 20 in the ratio 3 : 2, by dividing 20 by 5 and then multiplying by 3 or 2.
(20 ÷ 5) × 3 = 12 lions
(20 ÷ 5) × 2 = 8 tigers
A third of the lions are male.
12 ÷ 3 = 4
25% of the tigers are male.
8 ÷ 4 = 2
The number of female lions is 12 – 4 = 8.
The number of female tigers is 8 – 2 = 6.
8 + 6 = 14
The total number of female big cats is 14.
The probability that a big cat chosen at random is female is \(\frac{14}{20} \).
This simplifies to \(\frac{7}{10} \).
Quiz – Showing outcomes
Practise what you've learned about showing outcomes with this quiz.
Higher – How to use the product rule for two or more events
Finding the total number of outcomes
For two or more events, from different sets containing 𝑛, 𝑚, … outcomes, multiply the number of outcomes for each event together. This is the product of the number of outcomes for each event: 𝑛 × 𝑚 × …
For two events from the same set, containing 𝑛 where the order matters, the number of possible outcomes is 𝑛(𝑛 – 1).
For events based on one set, containing 𝑛 choices where order does not matter, the total number of outcomes is \(\frac{𝑛(𝑛 – 1)}{2} \).
Note that the total number of outcomes is found, not what each of these outcomes are.
Follow the worked examples below
i) Using the product rule to find the number of outcomes
ii) Using the product rule for a combination of events from a single set
GCSE exam-style questions
- Find the total number of outcomes for flipping 5 coins.

There are 32 possible outcomes when flipping five coins.
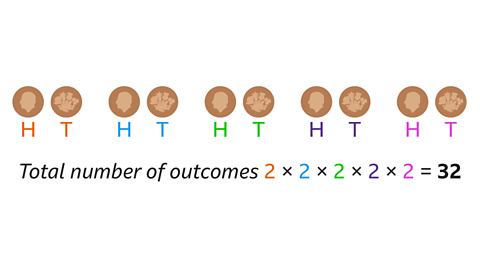
The total number of outcomes for five coins is found by multiplying the number of outcomes for each of the coins together.
The product is 2 × 2 × 2 × 2 × 2 = 32.
- 8 people attend a meeting.
Each person shakes hands with everyone else.
How many handshakes will there be altogether?

There will be 28 handshakes altogether.
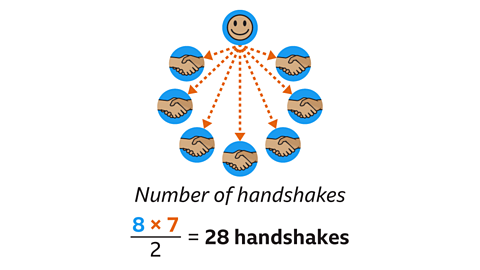
There are 8 people, and they each shake hands with the other 7 people in the group.
The product of 8 and 7 (56) will give double the number of handshakes because this includes, for example, person 1 shaking hands with person 2 and person 2 shaking hands with person 1.
As each pair of people shake hands only once, the product must be halved.
(8 × 7) ÷ 2 = 28
There will be 28 handshakes.
- A password is exactly 8 characters long.
Chloe can only use the digits 1, 2, 3, 4, lowercase letters c and d, capital V and character @ once each.
Find the total number of possible passwords Chloe can create.
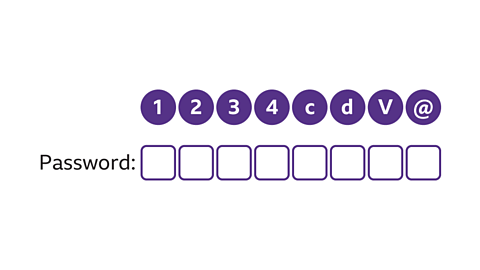
40,320
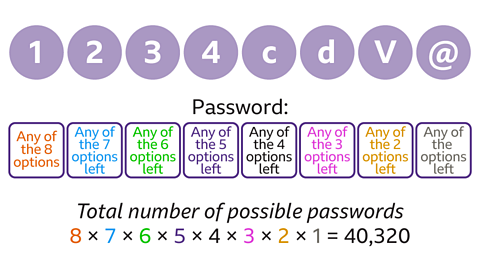
The first space can be filled by any of the eight characters, the second by any of the seven remaining options, the third space by any of the remaining six options and so on.
This gives a product of 8 × 7 × 6 × 5 × 4 × 3 × 2 × 1 = 40,320.
Higher – Quiz – Showing outcomes
Practise what you've learned about showing outcomes with this quiz for Higher tier.
Now you've revised showing outcomes, why not look at probability?
More on Probability
Find out more by working through a topic
- count4 of 6
- count5 of 6

- count1 of 6