A linear equation is drawn as a straight line on a set of axes.
To draw the graph we need coordinates.
We generate these coordinates by substituting values into the linear equation.
How do you draw graphs of linear equations?
How to draw a graph of a linear equation.
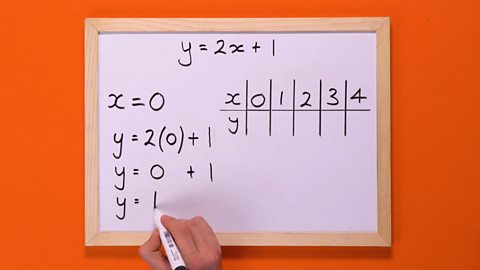
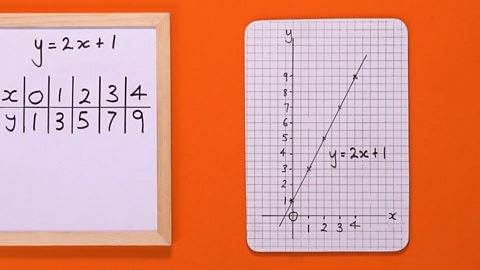
First draw a table of values and add the x values: 0, 1, 2, 3, and 4.
Now substitute the x value 0, calculate y, and write it down.
Now, do the same with 1: y = 3.
Do the same for the remaining x values: 2, 3, and 4.
y = 5, y = 7, y = 9.
Now you have all the x and y values, you can draw a graph.
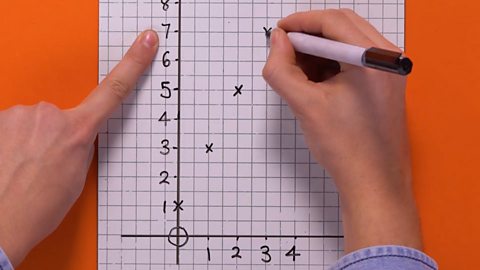
Add 0, 1, 2, 3 and 4 on the x axis and 1 up to 9 on the y axis.
Plot the coordinates on the graph, remember the x coordinate is always first.
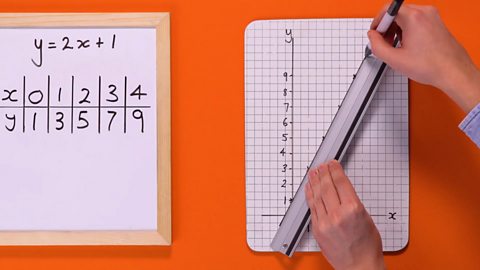
And draw a line through the points on the graph.
Voila!
Have a go yourself
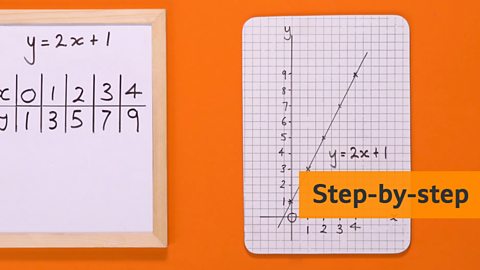
Image caption, Click to see a step-by-step slideshow.


1 of 8
How to draw a graph of a linear equation
A linear equation is represented as a line graph. In order to draw the line graph we require several pairs of coordinates. These coordinates represent the relationship given in the equation.
For example, for y = 3x, the y value is always equal to '3 lots' of the x value. (1,3), (10,30) and (2.5,7.5) are all coordinates on the line y = 3x.
Often a table of values is used to create the coordinates. We use substitution to calculate the values.
For example y = 2x + 1
The y value is always '2 lots' of the x value plus 1.
We replace the value of x for different numbers and record the resulting y value.
![A table with two rows and six columns. In the top row is written x (in bold), 0, 1, 2, 3 and 4. In the bottom row is written y (in bold), 1[(2x0)+1], 3 [(2x1)+1], 5 [(2x2)+1], 7 [(2x3)+1], 9 [(2x4)+1].](https://ichef.bbci.co.uk/images/ic/480xn/p06xpm7g.jpg)
More on Straight line graphs
Find out more by working through a topic
- count3 of 8

- count4 of 8
- count5 of 8

- count6 of 8