Real life situations such as travelling over time and across distance can be drawn on a graph.
Exact distances and times are plotted on the graph. These are shown as co-ordinates.
These points are then connected with straight lines to assist with further questions.
How do you draw a distance-time graph?
How to draw a graph from real-life examples.
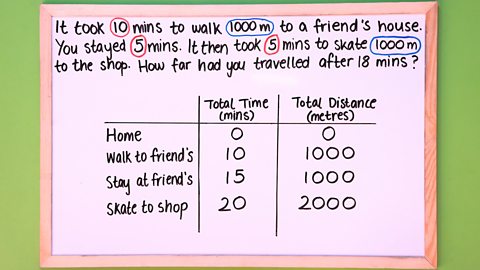
Imagine that you and a friend are going to the shop.
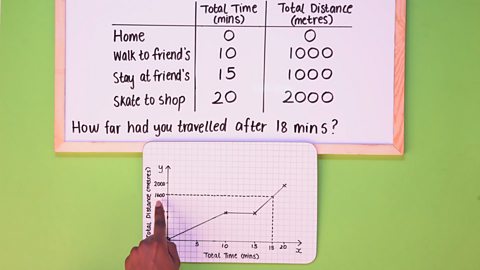
How far have you travelled after 18 minutes?
Draw a table to list the information more clearly. You need to know the total time and total distance travelled.
Starting at home means zero time and distance.
To your friend’s house took 10 minutes, travelling 1,000 metres.
Staying five minutes only increased the time, not the distance.
Skating to the shop added five minutes and another 1,000 metres.
Total time: 20 minutes. Total distance: 2,000 metres.
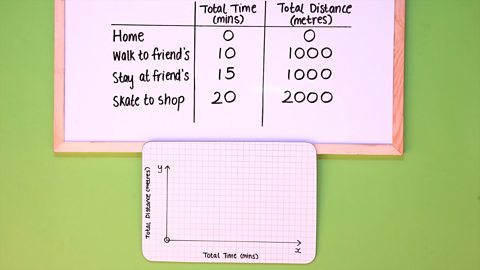
Time to plot your travels!
Total distance on the y axis, total time on the x axis.
Add zero to 2,000 on the total distance axis.
Add zero to 20 on the total time axis.
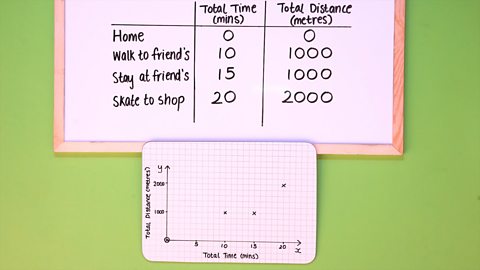
Plot the first point (0, 0), the second point (10, 1000), then (15, 1000) and finally (20, 2000).
Join each part of the journey with a straight line.
How far have you travelled after 18 minutes?
Find 18 on the total time axis.
Draw a dotted line up to your distance-time graph.
Read across the total distance axis.
So, after 18 minutes, you’ve travelled 1,600 metres!
How to plot your graph
A distance/time graph shows time on one axis (x) and distance on the other axis (y).
It is important to plot the important information from the problem.
For example:
(0,0) is the starting point because no time has passed and no distance has been travelled.
(10,1000) shows that after 10 minutes has passed a distance of 1000 m has been travelled.
Have a go yourself
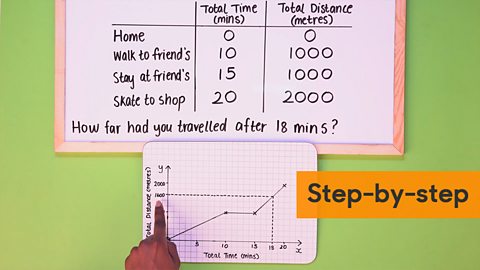
Image caption, Click to see a step-by-step slideshow.

1 of 6
More on Straight line graphs
Find out more by working through a topic
- count5 of 8
- count6 of 8

- count7 of 8

- count8 of 8