A quadratic equation is drawn as a curve on a set of axes. This type of curve is called a parabola and it is symmetrical.
To draw the graph we need coordinates.
We generate these coordinates by substituting values into the quadratic equation.
How do you draw a graph of a quadratic function?
How to draw a quadratic graph.
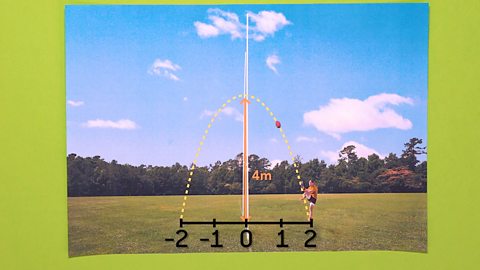
Kicking a ball four metres high creates a curve.
This curve is a quadratic, y = 4 - x squared.
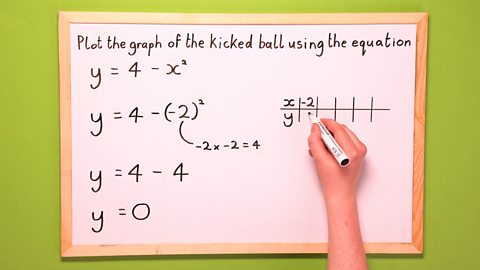
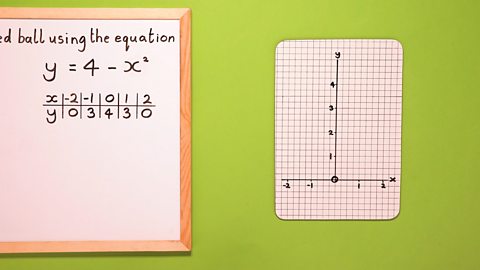
To plot this, first draw a table of values for the x coordinates and y coordinates.
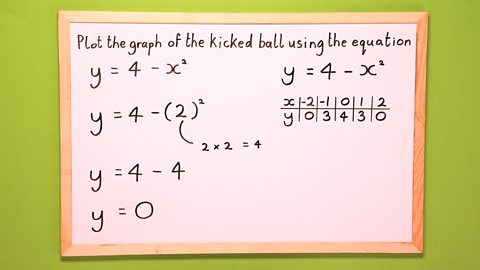
Substitute x values into the equation to find its corresponding y value.
Start with x = -2. Remember, a negative multiplied by a negative equals a positive.
When x = -2, y = 0.
Now substitute x = -1.
When x = -1, y = 3.
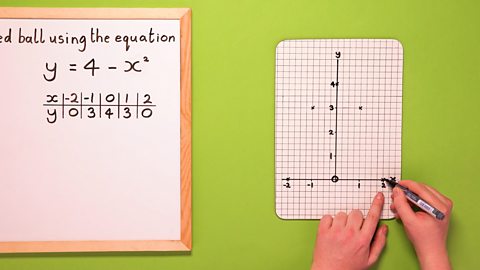
Try again with x = 0. x = 1, y = 3. x = 2, y = 0. Now we have five pairs of coordinates.
To plot them, draw the x and y axes.
Add -2, -1, 0, 1 and 2 on the x axis. And 1 up to 4 on the y axis.
Plot the coordinates on the axes. Remember, the x coordinate is always first.
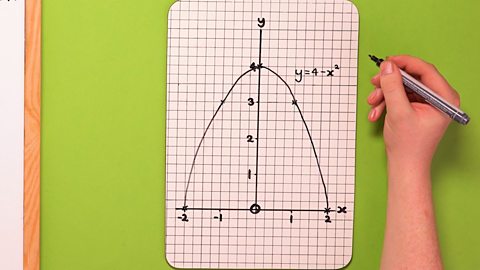
All five points are now plotted. Remember, it’s a curve, so join the points without using a ruler.
There it is - a quadratic graph, y = 4 - x squared.
Plotting your graph
A quadratic equation is represented as a curve on a set of axes. In order to draw the curve on a graph we require several pairs of coordinates. These coordinates represent the relationship given in the equation.
Eg y = 4 – x²
The y value is always 4 subtract the square of x.
We can make a table of values to create the coordinates. We use substitution to calculate the values.
We replace the value of x for different numbers and record the resulting y value.
These coordinates can then be plotted on a graph.
Have a go yourself
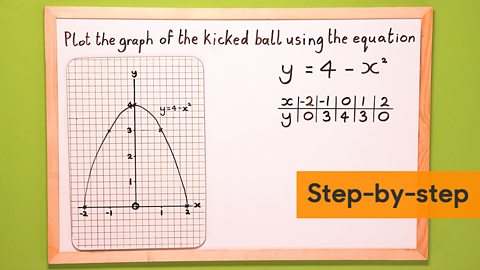
Image caption, Click to see a step-by-step slideshow.

1 of 8
More on Straight line graphs
Find out more by working through a topic
- count6 of 8

- count7 of 8

- count8 of 8

- count1 of 8