Identifying user and stakeholder requirements
Identifying problems and needs
Research before and after the A set of instructions given to a designer by a client. can identify any limitations to ideas and help with initial designs. Analysis of research and user feedback can lead to changes being made to the brief, such as a change in timescale or budget. The results of feedback, testing and Analysing the form and function of a product. should give the designer a good starting point to adapt, test, evaluate and improve their product.
Not all design is aimed at selling the maximum number of products. There are many problems that need solving for a very small The group of people a product is made for., for example:
- designing fastenings for small children to use
- creating products for the partially sighted, which might include bright colours or large buttons
- redesigning products using the ergonomic data of a wheelchair user
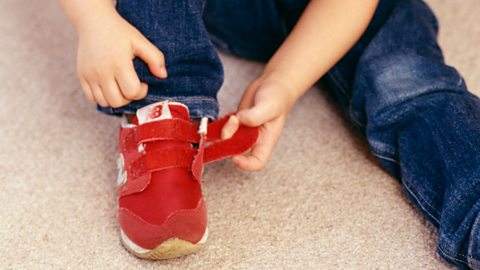
Image caption, Hook and loop (sometimes called Velcro) fastening for children

1 of 2
Regularly feeding back to the In business, a client is a person or organisation that wants a product manufactured, eg a retailer. ensures the designer continues to fulfil the aims of the design brief.
Primary data
Primary sources of information are gathered by the designer and used to help improve their designs:
- Gathering data and information about consumer needs and preferences. - Looking at products that already exist and talking to clients to collect a wide range of information on what is successful and what needs developing to ensure a product is viable. Interviews and questionnaires can be used to gather information on shape, colour, materials and function of existing products and the answers analysed to improve the product.
- A group of people who are the target market of a product whose opinions are sought. - Another valuable perspective can be found by talking to the product’s The group of people a product is made for.. Small groups can be interviewed, giving feedback before, during and after production, which can be used to improve the outcome.
- Analysing the form and function of a product. - Looking at products that already exist can help improve further designs by pinpointing issues to improve designs and The first working model of a design used for testing, development and evaluation..
- The study of body measurements. - Collecting maximum and minimum measurements about the target market’s sizes can help improve designs by making the product easier or more comfortable to use. Anthropometric data can be used to work out the Sizes and measurements. and The pressure from a weight on an object. of a product.
- The science of designing the product to fit the user, or the job to fit the worker. - Testing and analysing how a person interacts with the product can improve its functionality and how it fits into its surroundings.
Secondary data
Secondary sources of information use data already found by other people or organisations that are relevant:
- Existing data - Average anthropometric and The science of designing the product to fit the user, or the job to fit the worker. measurements are available online, as well as government statistics and a huge range of questionnaires and public opinion.
- A collective name for images, video and audio. - Books, newspaper articles, reviews and the internet all provide access to the opinions of others.
Presenting data
Data from questionnaires can be presented visually using graphs, pie charts and tables, making it easier to analyse and summarise. Anthropometric and ergonomic details collected can be averaged out to find the sizes that fit most users. The average measurement The place out of 100 where a piece of data lies - the 50th percentile is the average. is typically the biggest group of users sharing a measurement.
Example
In order to design a new shoe rack for a classroom, it would be useful to know the most common shoe size in the class. To record the data, a combined A way of counting. Vertical lines are jotted down and the fifth line is drawn horizontally across the four lines. This makes it very easy to count up as each set is equal to five. chart and frequency table will need to be produced, as shown below:
Using a tally chart speeds up the process of recording data - the tally is added together to give the frequency. To produce a A type of graph showing values that are represented by rectangular bars. of this data, the UK shoe size could go along the The line that runs along the bottom of a graph. and the frequency along the The line that runs up the side of a graph.:
Question
Below is bar chart of the handspan of students in a class:
Use the bar chart to complete the missing data in frequency table below:
| Handspan (mm) | Frequency |
| 100 ≤ × < 110 | |
| 110 ≤ × < 120 | |
| 120 ≤ × < 130 | |
| 130 ≤ × < 140 | |
| 140 ≤ × < 150 |
| Handspan (mm) | 100 ≤ × < 110 |
|---|---|
| Frequency |
| Handspan (mm) | 110 ≤ × < 120 |
|---|---|
| Frequency |
| Handspan (mm) | 120 ≤ × < 130 |
|---|---|
| Frequency |
| Handspan (mm) | 130 ≤ × < 140 |
|---|---|
| Frequency |
| Handspan (mm) | 140 ≤ × < 150 |
|---|---|
| Frequency |
| Handspan (mm) | Frequency |
| 100 ≤ × < 110 | 3 |
| 110 ≤ × < 120 | 2 |
| 120 ≤ × < 130 | 5 |
| 130 ≤ × < 140 | 4 |
| 140 ≤ × < 150 | 1 |
| Handspan (mm) | 100 ≤ × < 110 |
|---|---|
| Frequency | 3 |
| Handspan (mm) | 110 ≤ × < 120 |
|---|---|
| Frequency | 2 |
| Handspan (mm) | 120 ≤ × < 130 |
|---|---|
| Frequency | 5 |
| Handspan (mm) | 130 ≤ × < 140 |
|---|---|
| Frequency | 4 |
| Handspan (mm) | 140 ≤ × < 150 |
|---|---|
| Frequency | 1 |
