Statistics
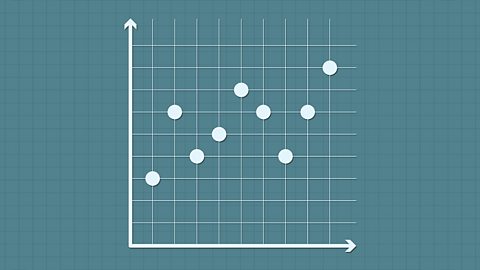
NEW: Scatter graphs and time series
Revise how to plot a scatter graph from a time series, as well as construct a line of best fit with which to make a prediction. This guide contains a quiz and exam-style questions.

NEW: Frequency tables, charts and diagrams
Revise how to construct a pictogram from a frequency table, as well as construct and interpret bar charts and pie charts. This guide contains a quiz and exam-style questions.

NEW: Higher – Cumulative frequency and box plots
Revise how to construct and interpret a cumulative frequency graph, as well as construct a box plot from the same data. This guide contains a quiz and exam-style questions.

NEW: Higher – Histograms
Revise how to construct, find frequencies and calculate the median from a histogram. This guide contains a quiz and exam-style questions.

NEW: Averages from a list of numbers
Revise how to calculate the mean, mode, median and range from a set of raw data. This guide contains a quiz and exam-style questions.

NEW: Averages from an ungrouped table
Revise how to find the mean, mode and median for a discrete frequency distribution. This guide contains an interactive activity, a quiz and exam-style questions.

NEW: Averages from a grouped table
Revise how to find the mean, mode and median from a grouped table. This guide contains a quiz and exam-style questions.

Collecting data - OCR
Many companies and organisations collect data to improve their information and products. Skills in collecting data can make this process more efficient and reliable.

Representing data - OCR
Data is represented in many different forms. Using bar charts, pie charts and frequency diagrams can make information easier to digest.
Analysing data - OCR
In statistics there are three types of average: the mean, the median and the mode. Measures of spread such as the range and the interquartile range can be used to reach statistical conclusions.

Links
- External linkExternal link
- SubscriptionSubscription
- External linkExternal link
- External linkExternal link
- External linkExternal link
