Key points about transformations of functions

A function, 𝑓(𝑥) relates an input and an output. The equation 𝑦 = 𝑥² can be written as the function 𝑓(𝑥) = 𝑥². The notation for a function is 𝑓(𝑥) or 𝑔(𝑥) or ℎ(𝑥) and so on.
Functions may be transformed by The movement of a shape, or function, from one place to another. The shape has the same orientation. This may be described in word, including horizontal and vertical. It can also be described using a vector. and A reflection is a mirror image of the shape or function. An image will reflect through a line, known as the line of reflection. The orientation of the shape, or function, changes.. The image is usually sketched on the same axes as the original graph. The image of coordinates can be predicted.
Sometimes transformations are combined. While its shape remains the same, the position/orientation of the graph may change.
A transformation can be applied to any graph including Describing an expression of the form 𝒂𝒙² + 𝒃𝒙 + 𝒄 where 𝒂, 𝒃 and 𝒄 are real numbers. The function = 𝒂𝒙² + 𝒃𝒙 + 𝒄 is a quadratic equation, its graph is a parabola. and Describing the relationship between the lengths of the sides of a right-angled triangle and a given angle Ɵ. The three main trigonometric functions are y= sinƟ , y =cosƟ and y=tanƟ. Trigonometric graphs are known as periodic waves because they have a repeated shape pattern. functions, as well as shapes on a grid.
Make sure you can draw translations and reflections, as well as recognise 𝑦 = sin𝑥 and 𝑦 = cos𝑥 to help when transforming trigonometric graphs.
Check your understanding
Transformations that translate functions
A A relationship between inputs and outputs, presented as an equation or a graph. , 𝑓(𝑥) is translated by 𝑛 units by an addition or subtraction of 𝑛, usually an Integers are numbers with no fraction or decimal part. They can be positive, negative or zero. 42, –8, and 10,000 are examples of integers. value.
- 𝑓(𝑥) + 𝑛 translates 𝑓(𝑥) vertically up by vector
The point (𝑥, 𝑦) becomes (𝑥, 𝑦 + 𝑛).
- 𝑓(𝑥) – 𝑛 translates 𝑓(𝑥) vertically down by vector
The point (𝑥, 𝑦) becomes (𝑥, 𝑦 – 𝑛).
- 𝑓(𝑥 + 𝑛) translates 𝑓(𝑥) horizontally to the left by vector
The point (𝑥, 𝑦) becomes (𝑥 – 𝑛 , 𝑦).
- 𝑓(𝑥 – 𝑛) translates 𝑓(𝑥) horizontally to the right by vector
The point (𝑥, 𝑦) becomes (𝑥 + 𝑛 , 𝑦).
Find out more below, along with a worked example
GCSE exam-style questions

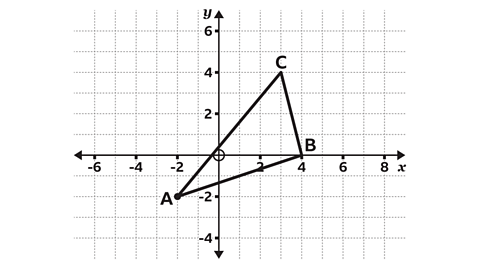
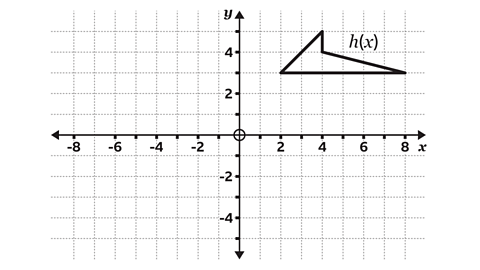
- The graph of the function 𝑔(𝑥) forms the shape of triangle 𝐴𝐵𝐶.
Sketch the transformation of 𝑔(𝑥 + 3) and find the image A' of vertex A (–2, –2).
The point A (–2, –2) is translated to the image A' (–5, –2).
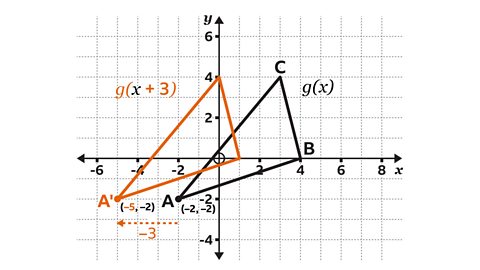
The transformation given by 𝑔(𝑥 + 3) represents a horizontal translation.
The shape of the function does not change.
Each point is translated 3 units to the left which means that 3 is subtracted from each 𝑥-coordinate.
(𝑥, 𝑦) becomes (𝑥 – 3, 𝑦).
The translation is given by the vector
\(\begin{pmatrix}– 3 \\0\end{pmatrix}\)- The function ℎ(𝑥) is shown.
Sketch the transformation ℎ(𝑥 – 6) + 2 and work out the image of the point (0, 5).
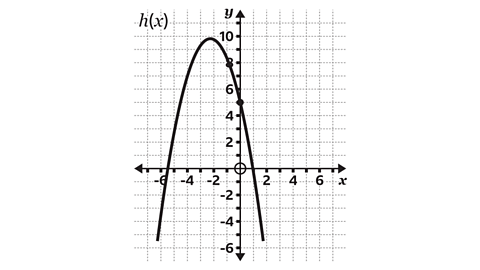
The image is (6, 7).
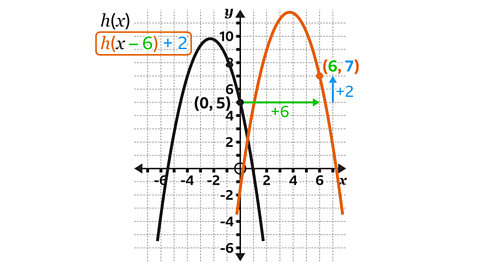
The transformation given by ℎ(𝑥 – 6) + 2 represents a horizontal translation 6 units to the right and a vertical translation 2 units up.
The shape of the function does not change.
Each point is translated 6 units to the right and 2 units up.
(𝑥, 𝑦) becomes (𝑥 + 6, 𝑦 + 2).
This translation is given by the vector
\(\begin{pmatrix}6 \\2\end{pmatrix}\)The image of (0, 5) is (0 + 6, 5 +2) = (6, 7).
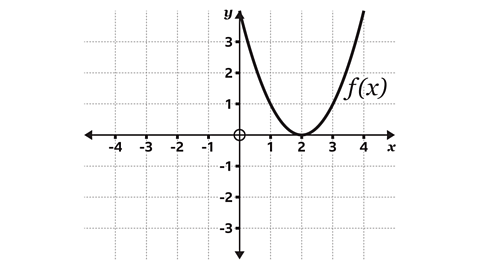
- The diagram shows the wave function ℎ(𝑥 – 2) + 3.
Sketch the function ℎ(𝑥).
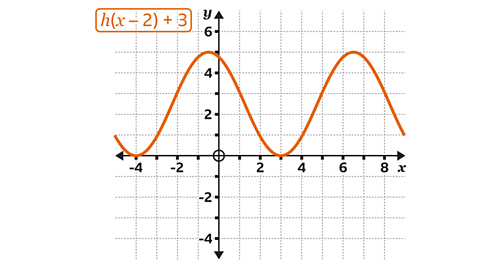
The function ℎ(𝑥 – 2) + 3 is the result of translating ℎ(𝑥) horizontally two units to the right and vertically three units up.
This translation is given by the vector
\(\begin{pmatrix}2 \\3\end{pmatrix}\)This means that a point (𝑥, 𝑦) has been translated to (𝑥 + 2) (𝑦 + 3).
To sketch the original function, ℎ(𝑥), the process is reversed.
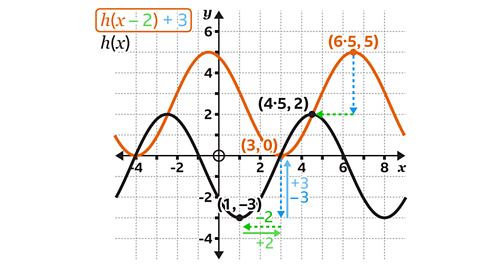
- Translate ℎ(𝑥 – 2) + 3 horizontally two units to the left and vertically three units down.
The reverse translation is given by the vector
\(\begin{pmatrix} –2 \\ –3 \end{pmatrix} \)- Choose some points to help with this so that (𝑥, 𝑦) has been translated to (𝑥 – 2), (𝑦 – 3).
For example, (3, 0) will be translated to (1, –3) and (6·5, 5) will be translated to (4·5, 2).
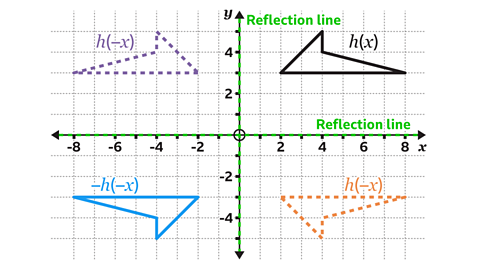
Transformations that reflect functions
A function, 𝑔(𝑥), is reflected when the sign is changed.
–𝑔(𝑥) reflects 𝑔(𝑥) in the 𝑥-axis. The point (𝑥, 𝑦) becomes (𝑥, – 𝑦).
𝑔( – 𝑥) reflects 𝑔(𝑥) in the 𝑦-axis. The point (𝑥, 𝑦) becomes (– 𝑥, 𝑦).
–𝑔( – 𝑥) reflects 𝑔(𝑥) in both the 𝑥-axis and 𝑦-axis. The point (𝑥, 𝑦) becomes
(– 𝑥, – 𝑦).
For functions that are A shape or graph that has symmetry. For example, reflective symmetry means the shape or graph is identical on both sides of a mirror line. about the Two reference lines, one horizontal (the 𝑥 axis) and one vertical (the 𝑦 axis) that cross at right-angles on a grid. Axes is the plural of axis. , the resulting image will look the same.
When the function remains the same, it is said to be A vertex or line segment that does not change after a transformation..
An invariant coordinate lies on the line of reflection.
Explore combined transformations and invariant points to support your confidence when working with transformations that reflect functions.
Follow the worked examples below
GCSE exam-style questions
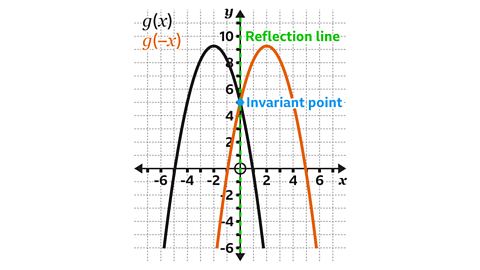
- The function shown is 𝑔(𝑥).
Sketch the transformation 𝑔(– 𝑥).
Which point is the invariant?
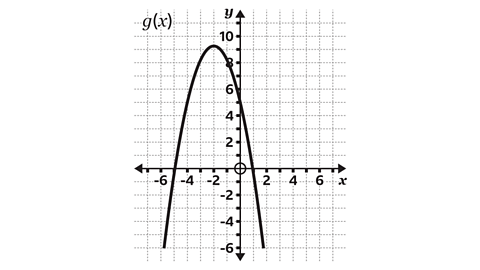
𝑔(– 𝑥) reflects 𝑔(𝑥) in the 𝑦- axis.
The invariant point does not change position.
This is (0, 5) and it lies on the line of reflection.
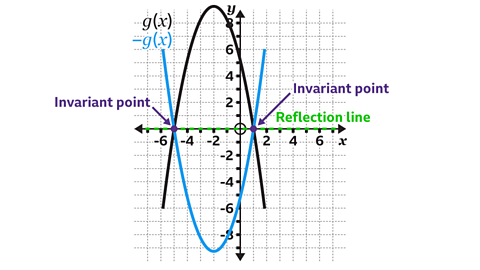
- The function shown is 𝑔(𝑥).
Sketch the transformation – 𝑔(𝑥).
Which point is the invariant?
– 𝑔(𝑥) reflects 𝑔(𝑥) in the 𝑥-axis.
There are two invariant points that do not change position. These are (– 5, 0) and (1, 0) and they both lie on the 𝑥-axis, the line of reflection.
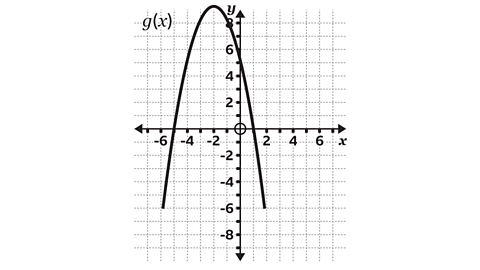
- The function ℎ(𝑥) is shown on the axes.
Sketch the transformation – ℎ( – 𝑥).
– ℎ( – 𝑥) reflects ℎ(𝑥) in the 𝑥-axis and 𝑦-axis.
This can be carried out in either order.
The image of the two reflections is the same as a rotation of 180° about the origin.
What are combined transformations?
Combined transformations involve more than one translation, reflection or both.
When the transformations are of the same type, the order in which they are carried out does not matter.
For example:
- – 𝑓(𝑥 + 3) is a reflection in the 𝑥-axis followed by a translation left 3 units.
- 𝑓(– 𝑥) – 2 is a reflection in the 𝑦-axis followed by a translation down 2 units.
When a function has more than one transformation, the order matters. Check each part of the combined function carefully.
- Transformations outside the brackets follow the standard order of operations (multiplication/reflection before addition/translation).
For example, –𝑓 (𝑥) + 2 means reflect in the 𝑥-axis first, then translate up 2 units.
- Transformations inside the brackets can be more complex.
For example, 𝑓(– 𝑥 + 2) involves a reflection in the 𝑦-axis and a horizontal translation.
If you are unsure how a combined transformation looks, work out some coordinates to help you.
Follow the worked examples below
GCSE exam-style questions
- The function 𝑓(𝑥) is transformed to 3 + 𝑓(– 𝑥).
Work out the image of the point (5, – 2).
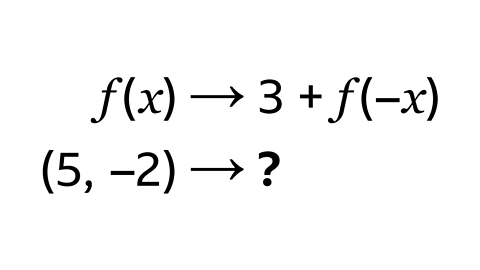
The image of the point (5, – 2) is (– 5, 1).
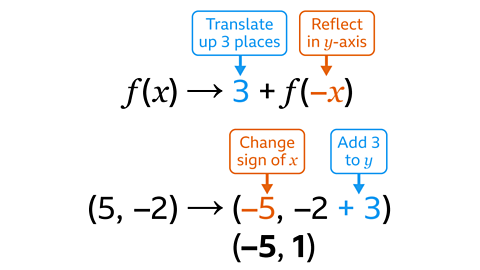
3 + 𝑓(– 𝑥) shows that the function 𝑓(𝑥) has been reflected in the 𝑦-axis and translated 3 units up.
The reflection in the 𝑦-axis changes the sign of the 𝑥-coordinate.
The translation up 3 units increases the 𝑦-coordinate by 3.
- The function of 𝑝(𝑥) is transformed to 𝑞(𝑥).
Write 𝑞(𝑥) in terms of 𝑝(𝑥).
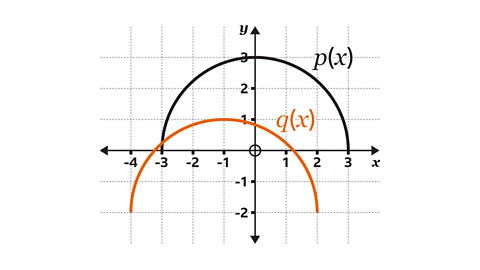
𝑞(𝑥) = 𝑝(𝑥 + 1) – 2
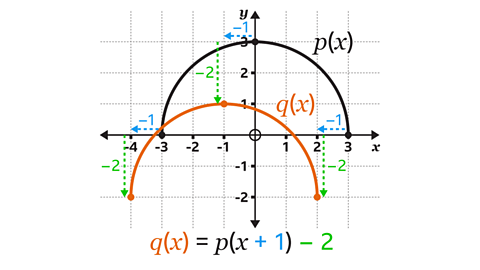
The function 𝑝(𝑥) has been translated one unit to the left and two units down to the image 𝑞(𝑥).
This is a translation by vector
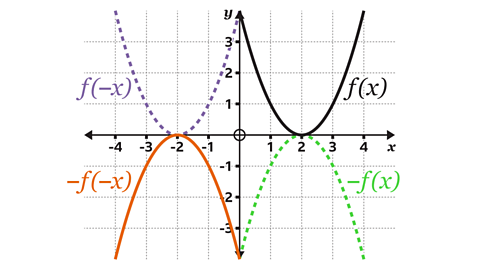
\(\begin{pmatrix} –1 \\–2 \end{pmatrix}\)- The function 𝑓(𝑥) is transformed to – 𝑓(– 𝑥).
On a copy of the diagram, sketch – 𝑓(– 𝑥).
– 𝑓( – 𝑥) reflects function 𝑓(𝑥) in the 𝑥- axis and 𝑦- axis.
The reflections can be carried out in either order.
Transformations on trigonometric graphs
Applying transformations of functions to Describing the relationship between the lengths of the sides of a right-angled triangle and a given angle Ɵ. The three main trigonometric functions are y= sinƟ , y =cosƟ and y=tanƟ. Trigonometric graphs are known as periodic waves because they have a repeated shape pattern. graphs is carried out in the same way as other functions.
When using the function sin(𝑥), there are:
- vertical translations for sin(𝑥) + 𝑛 and sin(𝑥) – 𝑛
- horizontal translations for sin(𝑥 + 𝑛) and sin(𝑥 – 𝑛)
- reflections for – sin(𝑥) and sin(– 𝑥)
Transformations can be combined.
Follow the worked examples below
GCSE exam-style questions
- Function 𝑓(𝑥) = cos(𝑥).
Work out a possible equation for the function 𝑔(𝑥) in terms of cos(𝑥), following a single transformation.
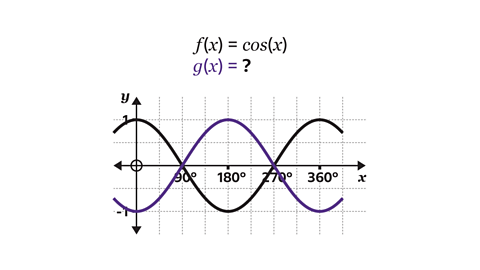
𝑔(𝑥) = cos(𝑥 + 180)
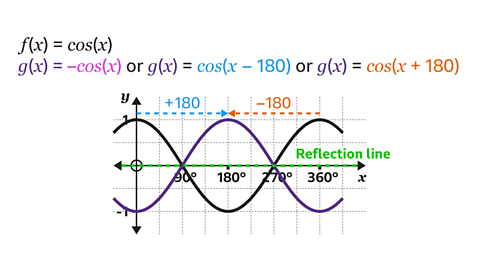
There is more than one possible equation that could represent 𝑔(𝑥).
One possible solution is that 𝑔(𝑥) is a reflection of 𝑓(𝑥) in the 𝑥-axis.
This means that 𝑔(𝑥) = – 𝑓(𝑥), 𝑔(𝑥) = – cos(𝑥).
Another possibility is that 𝑔(𝑥) is the result of translating 𝑓(𝑥) 180 units to the right, and this would give 𝑔(𝑥) = cos(𝑥 – 180).
This would also work if 𝑓(𝑥) was translated 180 units to the left and this would give 𝑔(𝑥) = cos(𝑥 + 180).
- ℎ(𝑥) = sin(𝑥).
Sketch the function 3 + sin(𝑥 + 45).
Work out the image of point 𝑃, (30, 0·5).
The image of 𝑃 (30, 0·5) is 𝑃' (– 15, 3·5).
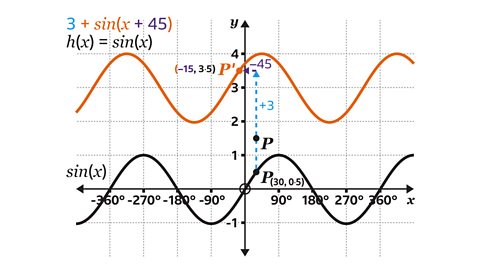
3 + sin(𝑥 + 45) is the image of sin(𝑥) after a translation up three units, as well as a translation 45 units to the left.
Each point (𝑥, 𝑦) is translated (𝑥 – 45, 𝑦 + 3).
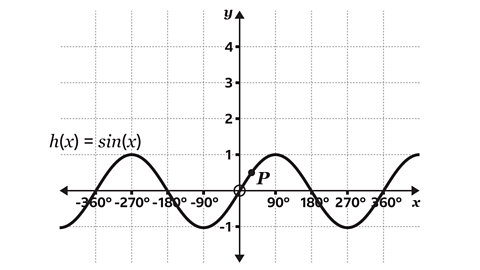
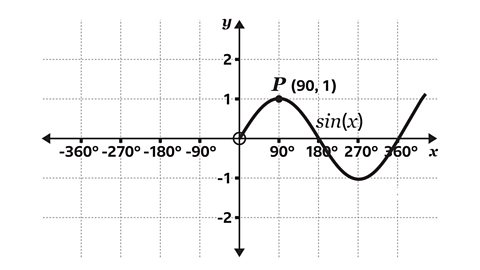
- The function 𝑓(𝑥) = sin(𝑥) is shown for values of 𝑥 from 0° to 360°.
Sketch the function 𝑓(– 𝑥) and write the function in terms of sin(𝑥).
Work out the image of point 𝑃, (90, 1).
The image of 𝑃' of point 𝑃 is (–90, 1).
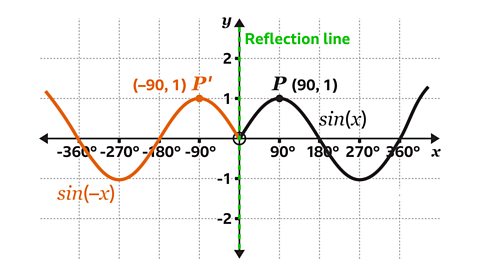
The function sin(– 𝑥) is the image of sin(𝑥) after a reflection in the 𝑦- axis.
Any coordinate (𝑥, 𝑦) becomes (– 𝑥, 𝑦).
Quiz – Transformations of functions
Practise what you've learned about transformation of functions with this quiz.
Now you've revised transformations of functions, why not look at geometric problems using vectors?
More on Algebra
Find out more by working through a topic
- count2 of 17

- count3 of 17

- count4 of 17